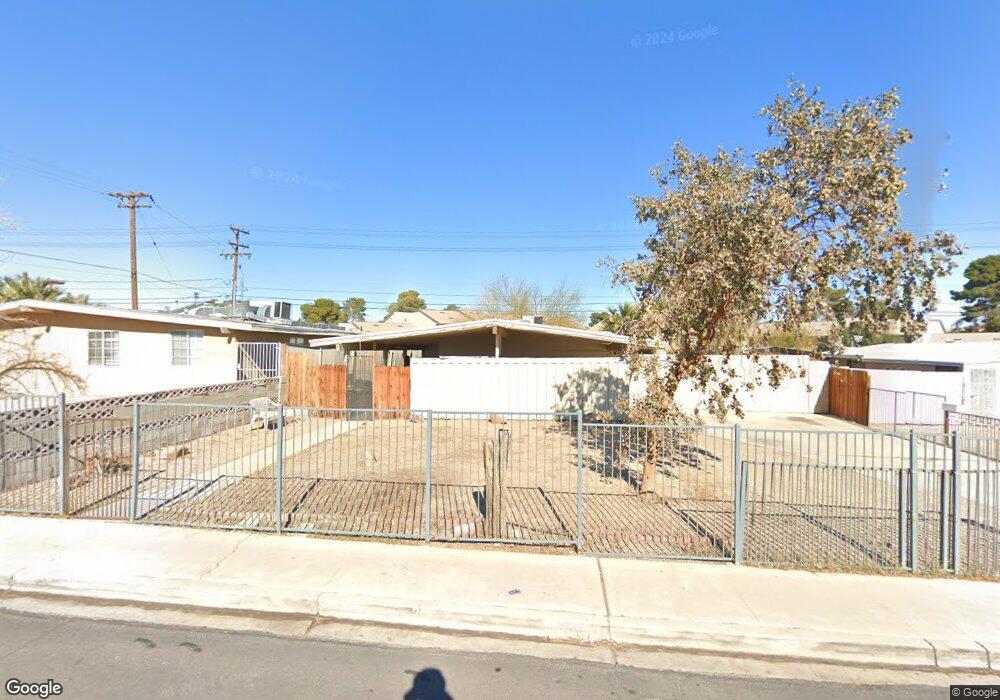
1508 E Mcwilliams Ave Las Vegas, NV 89101
Downtown Las Vegas NeighborhoodEstimated Value: $286,877 - $375,000
3
Beds
2
Baths
1,180
Sq Ft
$285/Sq Ft
Est. Value
About This Home
This home is located at 1508 E Mcwilliams Ave, Las Vegas, NV 89101 and is currently estimated at $336,719, approximately $285 per square foot. 1508 E Mcwilliams Ave is a home located in Clark County with nearby schools including Halle Hewetson Elementary School, J.D. Smith Middle School, and Rancho High School.
Ownership History
Date
Name
Owned For
Owner Type
Purchase Details
Closed on
Apr 30, 2008
Sold by
Holdem Holdings A Llc
Bought by
Lopez Guzman Luis F
Current Estimated Value
Home Financials for this Owner
Home Financials are based on the most recent Mortgage that was taken out on this home.
Original Mortgage
$159,497
Outstanding Balance
$100,638
Interest Rate
5.81%
Mortgage Type
FHA
Estimated Equity
$236,081
Purchase Details
Closed on
Apr 28, 2008
Sold by
Padilla Rosalba Pureco
Bought by
Lopez Guzman Luis F
Home Financials for this Owner
Home Financials are based on the most recent Mortgage that was taken out on this home.
Original Mortgage
$159,497
Outstanding Balance
$100,638
Interest Rate
5.81%
Mortgage Type
FHA
Estimated Equity
$236,081
Purchase Details
Closed on
Jul 24, 2007
Sold by
Wirth Robert L and Day Wirth Michelle
Bought by
Holdem Holdings A Llc
Purchase Details
Closed on
Mar 8, 2007
Sold by
Nolte Kelly J
Bought by
Bobco Family Lp
Create a Home Valuation Report for This Property
The Home Valuation Report is an in-depth analysis detailing your home's value as well as a comparison with similar homes in the area
Home Values in the Area
Average Home Value in this Area
Purchase History
| Date | Buyer | Sale Price | Title Company |
|---|---|---|---|
| Lopez Guzman Luis F | $162,000 | Fidelity National Title | |
| Lopez Guzman Luis F | -- | Fidelity National Title | |
| Holdem Holdings A Llc | -- | None Available | |
| Wirth Robert L | -- | None Available | |
| Bobco Family Lp | $135,000 | Land Title Of Nevada |
Source: Public Records
Mortgage History
| Date | Status | Borrower | Loan Amount |
|---|---|---|---|
| Open | Lopez Guzman Luis F | $159,497 |
Source: Public Records
Tax History Compared to Growth
Tax History
| Year | Tax Paid | Tax Assessment Tax Assessment Total Assessment is a certain percentage of the fair market value that is determined by local assessors to be the total taxable value of land and additions on the property. | Land | Improvement |
|---|---|---|---|---|
| 2025 | $1,051 | $42,443 | $25,900 | $16,543 |
| 2024 | $1,590 | $42,443 | $25,900 | $16,543 |
| 2023 | $431 | $44,055 | $29,050 | $15,005 |
| 2022 | $600 | $36,832 | $23,450 | $13,382 |
| 2021 | $555 | $29,965 | $17,500 | $12,465 |
| 2020 | $513 | $27,853 | $15,750 | $12,103 |
| 2019 | $481 | $25,666 | $14,000 | $11,666 |
| 2018 | $459 | $23,918 | $12,950 | $10,968 |
| 2017 | $700 | $21,368 | $10,500 | $10,868 |
| 2016 | $431 | $18,586 | $8,050 | $10,536 |
| 2015 | $428 | $15,822 | $5,600 | $10,222 |
| 2014 | $713 | $13,079 | $4,200 | $8,879 |
Source: Public Records
Map
Nearby Homes
- 700 N 14th St
- 629 N 16th St
- 624 N Bruce St
- 828 Held Rd
- 833 N Bruce St
- 1812 Ryan Ave
- 507 N 15th St
- 1705 Leslie Ave Unit 1
- 513 N 13th St
- 513 N 13th Bldg A St
- 610 N 11th St
- 637 N 11th St
- 640 N 10th St
- 0 Thirteenth Unit 2707474
- 416 N 15th St
- 709 N 22nd St
- 1908 Linden Ave
- 828 N 21st St
- 2020 E Bonanza Rd
- 2016 Linden Ave
- 1512 E Mcwilliams Ave
- 1504 E Mcwilliams Ave
- 1504 E Mcwilliams Ave
- 1600 E Mcwilliams Ave
- 1500 E Mcwilliams Ave
- 1509 E Mcwilliams Ave
- 1513 E Mcwilliams Ave
- 1505 E Mcwilliams Ave
- 1604 E Mcwilliams Ave
- 1412 E Mcwilliams Ave
- 1501 E Mcwilliams Ave
- 1601 E Mcwilliams Ave
- 1608 E Mcwilliams Ave
- 1408 E Mcwilliams Ave
- 1413 E Mcwilliams Ave
- 1605 E Mcwilliams Ave
- 1508 Margaret Ave
- 1512 Margaret Ave
- 1504 Margaret Ave
- 720 N 16th St