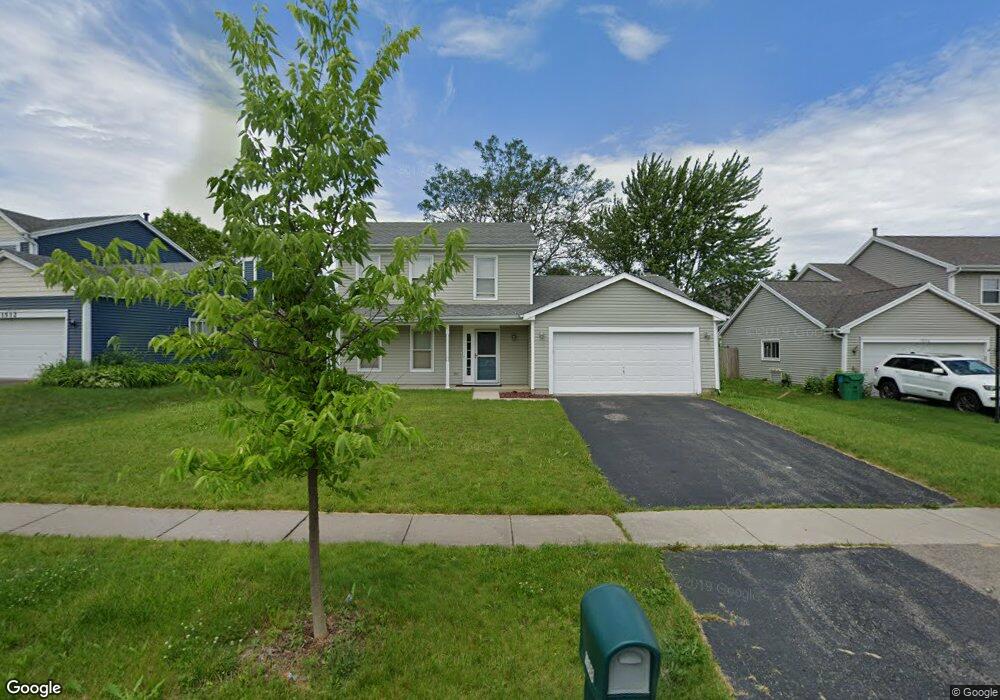
1508 Hollytree Ln Crystal Lake, IL 60014
Estimated Value: $299,016 - $370,000
3
Beds
3
Baths
1,683
Sq Ft
$206/Sq Ft
Est. Value
About This Home
This home is located at 1508 Hollytree Ln, Crystal Lake, IL 60014 and is currently estimated at $346,754, approximately $206 per square foot. 1508 Hollytree Ln is a home located in McHenry County with nearby schools including Indian Prairie Elementary School, Lundahl Middle School, and Crystal Lake South High School.
Ownership History
Date
Name
Owned For
Owner Type
Purchase Details
Closed on
Oct 15, 2008
Sold by
Bruner Marvin T
Bought by
Bruner Julie A
Current Estimated Value
Purchase Details
Closed on
Jan 5, 2007
Sold by
Macklin Wayne H and Macklin Joan L
Bought by
Bruner Marvin T and Bruner Julie A
Purchase Details
Closed on
Jul 31, 1998
Sold by
Bryan David and Bryan Jodi A
Bought by
Macklin Joan L and Macklin Wayne H
Home Financials for this Owner
Home Financials are based on the most recent Mortgage that was taken out on this home.
Original Mortgage
$118,000
Interest Rate
7.05%
Purchase Details
Closed on
Nov 18, 1994
Sold by
Robins Michael J and Robins Susan M
Bought by
Bryan David and Bryan Jodi A
Home Financials for this Owner
Home Financials are based on the most recent Mortgage that was taken out on this home.
Original Mortgage
$119,950
Interest Rate
8.37%
Create a Home Valuation Report for This Property
The Home Valuation Report is an in-depth analysis detailing your home's value as well as a comparison with similar homes in the area
Home Values in the Area
Average Home Value in this Area
Purchase History
| Date | Buyer | Sale Price | Title Company |
|---|---|---|---|
| Bruner Julie A | -- | None Available | |
| Bruner Marvin T | -- | None Available | |
| Macklin Joan L | $147,500 | Land Title Group | |
| Bryan David | $133,500 | Chicago Title |
Source: Public Records
Mortgage History
| Date | Status | Borrower | Loan Amount |
|---|---|---|---|
| Previous Owner | Macklin Joan L | $118,000 | |
| Previous Owner | Bryan David | $119,950 |
Source: Public Records
Tax History Compared to Growth
Tax History
| Year | Tax Paid | Tax Assessment Tax Assessment Total Assessment is a certain percentage of the fair market value that is determined by local assessors to be the total taxable value of land and additions on the property. | Land | Improvement |
|---|---|---|---|---|
| 2024 | $6,848 | $88,891 | $16,992 | $71,899 |
| 2023 | $6,584 | $79,502 | $15,197 | $64,305 |
| 2022 | $6,793 | $77,715 | $22,741 | $54,974 |
| 2021 | $6,413 | $72,401 | $21,186 | $51,215 |
| 2020 | $6,245 | $69,838 | $20,436 | $49,402 |
| 2019 | $6,074 | $66,844 | $19,560 | $47,284 |
| 2018 | $5,678 | $61,749 | $18,069 | $43,680 |
| 2017 | $5,632 | $58,171 | $17,022 | $41,149 |
| 2016 | $5,476 | $54,559 | $15,965 | $38,594 |
| 2013 | -- | $55,962 | $14,894 | $41,068 |
Source: Public Records
Map
Nearby Homes
- 1391 Acadia Cir
- 1549 Hollytree Ln Unit 2
- 1421 Acadia Cir
- 1451 Acadia Cir
- 1441 Acadia Cir
- 1461 Acadia Cir
- 1542 Candlewood Dr
- 1549 Brompton Ln
- 1420 Trailwood Dr
- 1655 Kennsington Ln
- 1644 Stockton Ln
- 1668 Penn Ct Unit A
- 1644 Brigham Ln
- 761 Village Rd
- 1694 Penny Ln Unit A
- 1740 Bradford Ln
- 1724 Hartford Ln
- 1724 Becker Ct
- 1823 Somerfield Ln
- 1201 Boxwood Dr
- 1504 Hollytree Ln
- 1512 Hollytree Ln
- 728 Laguna Rd
- 719 Alexandra Blvd
- 725 Alexandra Blvd
- 1507 Hollytree Ln
- 1503 Hollytree Ln
- 1511 Hollytree Ln
- 1515 Hollytree Ln
- 1524 Hollytree Ln Unit 2
- 731 Alexandra Blvd
- 1519 Hollytree Ln
- 738 Laguna Rd
- 1510 Shelton Ln
- 1516 Shelton Ln
- 1523 Hollytree Ln
- 737 Alexandra Blvd
- 1522 Shelton Ln
- 744 Laguna Rd