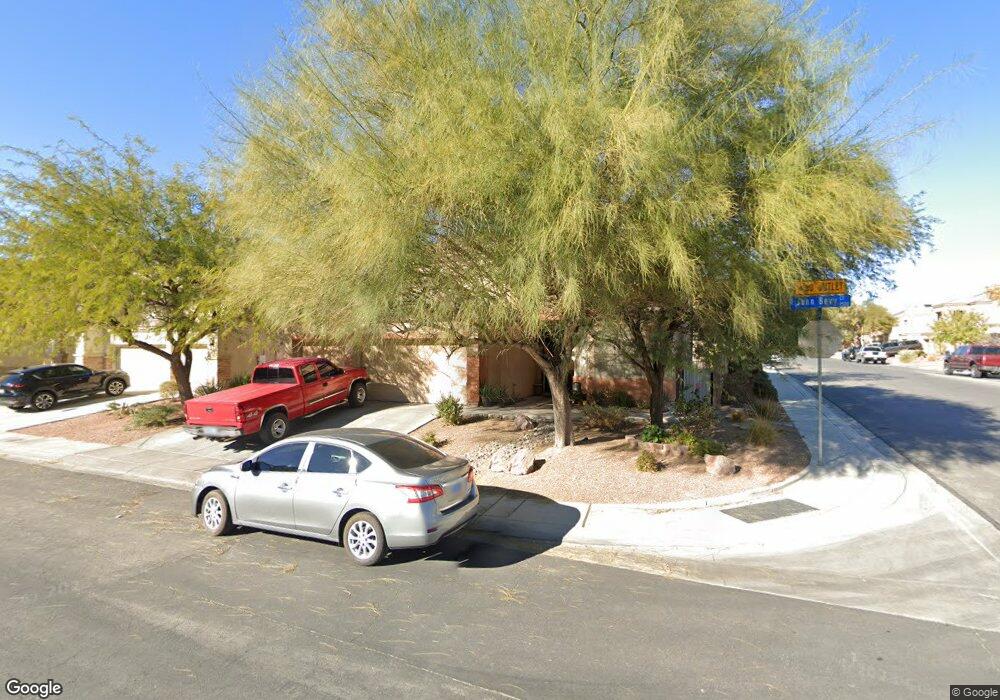
1508 John Bevy Ct North Las Vegas, NV 89086
Deer Springs NeighborhoodEstimated Value: $533,000 - $552,000
4
Beds
4
Baths
3,170
Sq Ft
$171/Sq Ft
Est. Value
About This Home
This home is located at 1508 John Bevy Ct, North Las Vegas, NV 89086 and is currently estimated at $541,355, approximately $170 per square foot. 1508 John Bevy Ct is a home located in Clark County with nearby schools including Don E. Hayden Elementary School, Ruby Duncan Elementary School, and Carroll M. Johnston STEM Academy of Environmental Studies.
Ownership History
Date
Name
Owned For
Owner Type
Purchase Details
Closed on
May 28, 2008
Sold by
Federal Home Loan Mortgage Corporation
Bought by
Michel Javier and Michel Ramona
Current Estimated Value
Home Financials for this Owner
Home Financials are based on the most recent Mortgage that was taken out on this home.
Original Mortgage
$233,900
Interest Rate
6.04%
Mortgage Type
Unknown
Purchase Details
Closed on
Dec 6, 2007
Sold by
Wong Dennis T
Bought by
Federal Home Loan Mortgage Corporation
Purchase Details
Closed on
Sep 9, 2005
Sold by
Wong Dennis T
Bought by
Zebra 3 Llc
Purchase Details
Closed on
May 31, 2005
Sold by
Centex Homes
Bought by
Wong Dennis T
Home Financials for this Owner
Home Financials are based on the most recent Mortgage that was taken out on this home.
Original Mortgage
$344,900
Interest Rate
5.75%
Mortgage Type
Fannie Mae Freddie Mac
Create a Home Valuation Report for This Property
The Home Valuation Report is an in-depth analysis detailing your home's value as well as a comparison with similar homes in the area
Home Values in the Area
Average Home Value in this Area
Purchase History
| Date | Buyer | Sale Price | Title Company |
|---|---|---|---|
| Michel Javier | $259,900 | Servicelink | |
| Federal Home Loan Mortgage Corporation | -- | None Available | |
| Zebra 3 Llc | -- | -- | |
| Wong Dennis T | $431,178 | Commerce Title |
Source: Public Records
Mortgage History
| Date | Status | Borrower | Loan Amount |
|---|---|---|---|
| Closed | Michel Javier | $233,900 | |
| Previous Owner | Wong Dennis T | $344,900 | |
| Closed | Wong Dennis T | $64,650 |
Source: Public Records
Tax History Compared to Growth
Tax History
| Year | Tax Paid | Tax Assessment Tax Assessment Total Assessment is a certain percentage of the fair market value that is determined by local assessors to be the total taxable value of land and additions on the property. | Land | Improvement |
|---|---|---|---|---|
| 2025 | $2,319 | $164,239 | $43,400 | $120,839 |
| 2024 | $2,252 | $164,239 | $43,400 | $120,839 |
| 2023 | $2,252 | $154,287 | $36,400 | $117,887 |
| 2022 | $2,187 | $139,278 | $32,200 | $107,078 |
| 2021 | $2,123 | $113,842 | $28,350 | $85,492 |
| 2020 | $2,058 | $110,965 | $28,350 | $82,615 |
| 2019 | $1,998 | $109,058 | $23,800 | $85,258 |
| 2018 | $1,940 | $92,869 | $21,000 | $71,869 |
| 2017 | $3,055 | $91,062 | $19,250 | $71,812 |
| 2016 | $1,838 | $80,457 | $14,700 | $65,757 |
| 2015 | $1,834 | $62,563 | $11,200 | $51,363 |
| 2014 | $1,777 | $55,390 | $9,450 | $45,940 |
Source: Public Records
Map
Nearby Homes
- 1417 Crystal Rainey Ave
- 1409 Crystal Rainey Ave
- 1509 Peyton Stewart Ct
- 1804 Jake Andrew Ave
- 6417 Gardella Ct
- 2047 Arrington Ave
- 2113 Albury Ave
- 6512 N Bruce St
- 2114 Thelen Ave
- 2114 Cold Canyon Ave
- 6519 Summershade St
- 6535 Summershade St
- 1213 Bistro Bay Ave Unit 3
- 6504 N Austin Moore St
- 1129 Blissful Plains Ave
- 1130 Blissful Plains Ave
- 2261 Cold Canyon Ave
- 2379 Albury Ave
- 2014 Millergrove Ave
- 2211 Taylor Ranch Ave
- 1504 John Bevy Ct
- 1509 Crystal Rainey Ave
- 1420 John Bevy Ct
- 1608 John Bevy Ct
- 1505 Crystal Rainey Ave
- 1421 Crystal Rainey Ave
- 6704 Dave Pappas St
- 1513 John Bevy Ct
- 1509 John Bevy Ct
- 1416 John Bevy Ct
- 1605 John Bevy Ct
- 1505 John Bevy Ct
- 6708 Dave Pappas St
- 1612 John Bevy Ct
- 1609 John Bevy Ct
- 1417 John Bevy Ct Unit 2A
- 1412 John Bevy Ct Unit 2A
- 6712 Dave Pappas St
- 1413 Crystal Rainey Ave
- 6705 Courtney Michelle St