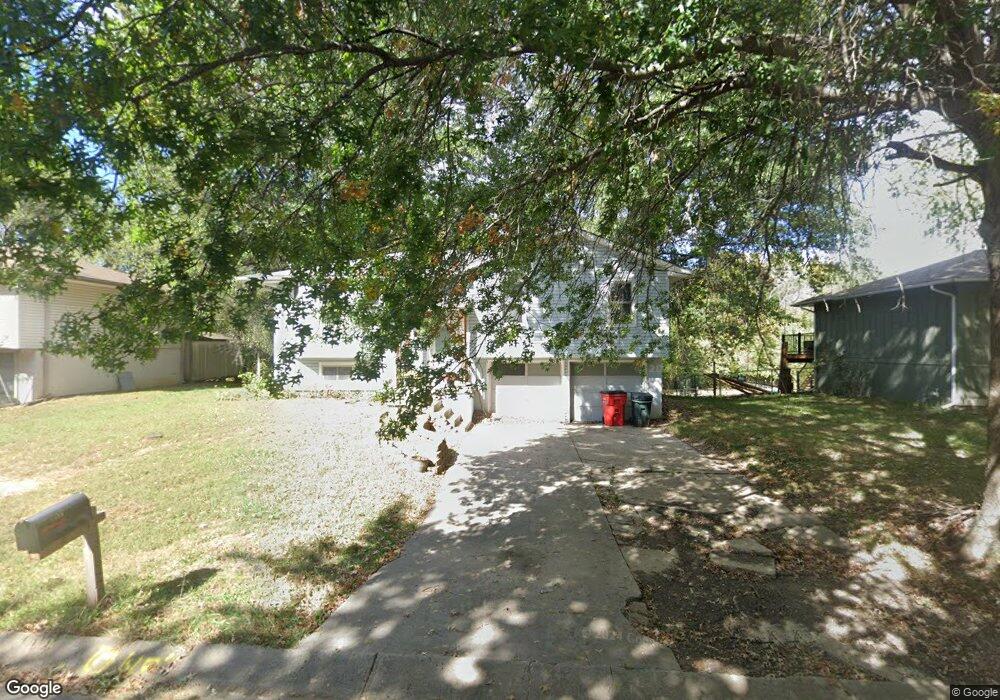
1508 SE 15th Place Oak Grove, MO 64075
Estimated Value: $210,000 - $231,000
3
Beds
1
Bath
1,066
Sq Ft
$208/Sq Ft
Est. Value
About This Home
This home is located at 1508 SE 15th Place, Oak Grove, MO 64075 and is currently estimated at $221,842, approximately $208 per square foot. 1508 SE 15th Place is a home located in Jackson County with nearby schools including Oak Grove Primary School, Oak Grove Elementary School, and Oak Grove Middle School.
Ownership History
Date
Name
Owned For
Owner Type
Purchase Details
Closed on
Oct 14, 2012
Sold by
Lance Richard D and Lance Faye N
Bought by
Ogmo Investment Corp
Current Estimated Value
Purchase Details
Closed on
Aug 26, 2005
Sold by
Graham Stanley D and Graham Paula Renee
Bought by
Grant Jerry
Home Financials for this Owner
Home Financials are based on the most recent Mortgage that was taken out on this home.
Original Mortgage
$81,600
Interest Rate
9.05%
Mortgage Type
Fannie Mae Freddie Mac
Purchase Details
Closed on
Jan 3, 1996
Sold by
Graham Stanley D and Graham Paula Renee
Bought by
Graham Stanley D and Graham Paula Renee
Home Financials for this Owner
Home Financials are based on the most recent Mortgage that was taken out on this home.
Original Mortgage
$35,000
Interest Rate
6.83%
Mortgage Type
Purchase Money Mortgage
Create a Home Valuation Report for This Property
The Home Valuation Report is an in-depth analysis detailing your home's value as well as a comparison with similar homes in the area
Home Values in the Area
Average Home Value in this Area
Purchase History
| Date | Buyer | Sale Price | Title Company |
|---|---|---|---|
| Ogmo Investment Corp | -- | Stewart Title Company | |
| Grant Jerry | -- | Cbkc Title & Escrow Llc | |
| Graham Stanley D | -- | -- |
Source: Public Records
Mortgage History
| Date | Status | Borrower | Loan Amount |
|---|---|---|---|
| Previous Owner | Grant Jerry | $81,600 | |
| Previous Owner | Graham Stanley D | $35,000 |
Source: Public Records
Tax History Compared to Growth
Tax History
| Year | Tax Paid | Tax Assessment Tax Assessment Total Assessment is a certain percentage of the fair market value that is determined by local assessors to be the total taxable value of land and additions on the property. | Land | Improvement |
|---|---|---|---|---|
| 2025 | $1,978 | $28,284 | $4,735 | $23,549 |
| 2024 | $1,978 | $25,462 | $4,777 | $20,685 |
| 2023 | $1,959 | $25,462 | $3,811 | $21,651 |
| 2022 | $1,970 | $23,370 | $4,807 | $18,563 |
| 2021 | $1,927 | $23,370 | $4,807 | $18,563 |
| 2020 | $1,888 | $22,306 | $4,807 | $17,499 |
| 2019 | $1,796 | $22,306 | $4,807 | $17,499 |
| 2018 | $1,596 | $20,794 | $3,446 | $17,348 |
| 2017 | $1,605 | $20,794 | $3,446 | $17,348 |
| 2016 | $1,605 | $20,273 | $3,648 | $16,625 |
| 2014 | $1,437 | $18,105 | $3,645 | $14,460 |
Source: Public Records
Map
Nearby Homes
- 1604 SE Kingsway St
- 1407 SE Hillside Dr
- 801 SE 13th St
- 1106 SE Chelsey Ln
- 1108 SE Oak Ridge Dr
- 809 SE 19th St
- TBD SE Horseshoe Dr
- 508 SE 12th St
- 2305 SE Horseshoe Dr
- 2004 SE Oak Ridge Dr
- 704 SE 21st St
- 612 SE 21st St
- 0 Fulks Rd
- 509 SE 20th St
- 2112 SE Oak Ridge Dr
- 2200 SE Oak Ridge Dr
- 701 SE 21st St
- 1312 SW Clinton St
- 704 SW Clinton St
- 1705 Locust St
- 1510 SE 15th Place
- 1506 SE 15th Place
- 1507 SE 15th Place
- 1512 SE 15th Place
- 1504 SE 15th Place
- 1505 SE 15th Place
- 1503 SE 15th Place
- 1503 SE 15th St
- 1511 SE 15th Place
- 1514 SE 15th Place
- 1502 SE 15th Place
- 1501 SE 15th Place
- 1513 SE 15th Place
- 1508 SE 16th Place
- 1506 SE 16th Place
- 1510 SE 16th Place
- 1408 SE 15th Place
- 1516 SE 15th Place
- 1504 SE 16th Place
- 1515 SE 15th Place