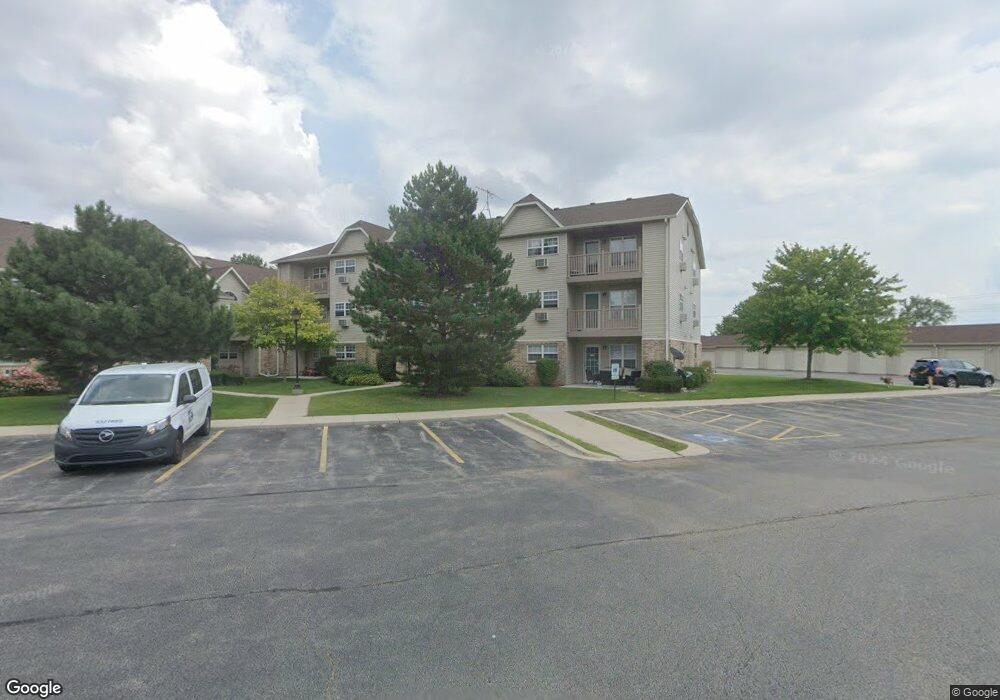
1508 Spring Brook Ct Unit 3 Round Lake Beach, IL 60073
Estimated Value: $157,000 - $177,000
2
Beds
1
Bath
968
Sq Ft
$173/Sq Ft
Est. Value
About This Home
This home is located at 1508 Spring Brook Ct Unit 3, Round Lake Beach, IL 60073 and is currently estimated at $167,670, approximately $173 per square foot. 1508 Spring Brook Ct Unit 3 is a home located in Lake County with nearby schools including Indian Hill Elementary School, Round Lake Middle School, and Round Lake High School.
Ownership History
Date
Name
Owned For
Owner Type
Purchase Details
Closed on
Dec 11, 2015
Sold by
Kim Bok Soon Shin and Kim San Sik
Bought by
Guild Properties Llc
Current Estimated Value
Purchase Details
Closed on
May 13, 2005
Sold by
Lutz Trevor W and Lutz Casey A
Bought by
Kim Boksoon Shin
Home Financials for this Owner
Home Financials are based on the most recent Mortgage that was taken out on this home.
Original Mortgage
$96,800
Interest Rate
5.25%
Mortgage Type
Negative Amortization
Purchase Details
Closed on
May 25, 2001
Sold by
Midwest Bank & Trust Company
Bought by
Lutz Trevor W and Lutz Casey A
Home Financials for this Owner
Home Financials are based on the most recent Mortgage that was taken out on this home.
Original Mortgage
$95,394
Interest Rate
7.11%
Mortgage Type
FHA
Create a Home Valuation Report for This Property
The Home Valuation Report is an in-depth analysis detailing your home's value as well as a comparison with similar homes in the area
Home Values in the Area
Average Home Value in this Area
Purchase History
| Date | Buyer | Sale Price | Title Company |
|---|---|---|---|
| Guild Properties Llc | $65,000 | Affinity Title Services Llc | |
| Kim Boksoon Shin | $121,000 | St | |
| Lutz Trevor W | $98,000 | -- |
Source: Public Records
Mortgage History
| Date | Status | Borrower | Loan Amount |
|---|---|---|---|
| Previous Owner | Kim Boksoon Shin | $96,800 | |
| Previous Owner | Lutz Trevor W | $95,394 |
Source: Public Records
Tax History Compared to Growth
Tax History
| Year | Tax Paid | Tax Assessment Tax Assessment Total Assessment is a certain percentage of the fair market value that is determined by local assessors to be the total taxable value of land and additions on the property. | Land | Improvement |
|---|---|---|---|---|
| 2024 | $3,815 | $42,712 | $2,184 | $40,528 |
| 2023 | $3,494 | $39,199 | $2,004 | $37,195 |
| 2022 | $3,494 | $35,163 | $1,734 | $33,429 |
| 2021 | $3,497 | $31,560 | $1,801 | $29,759 |
| 2020 | $3,421 | $30,029 | $1,714 | $28,315 |
| 2019 | $3,329 | $28,810 | $1,644 | $27,166 |
| 2018 | $3,111 | $23,513 | $2,102 | $21,411 |
| 2017 | $3,059 | $22,117 | $1,977 | $20,140 |
| 2016 | $2,965 | $20,416 | $1,825 | $18,591 |
| 2015 | $1,984 | $18,651 | $1,667 | $16,984 |
| 2014 | $2,796 | $24,335 | $1 | $24,334 |
| 2012 | $2,834 | $25,415 | $1 | $25,414 |
Source: Public Records
Map
Nearby Homes
- 1443 Spring Brook Ct Unit 1C
- 1584 W Crystal Rock Ct Unit 2B
- 34661 N Gerberding Ave
- 1475 W Sedgewood Ct
- 1506 W Turtle Creek Ln
- 34763 Peterson Ave
- 1688 W Turtle Creek Ln
- 1561 W Turtle Creek Ln
- 1160 N Red Oak Cir Unit 1160-1
- 1221 N Village Dr
- 931 N Fairfield Rd
- 1256 N Split Oak Cir
- 347 N Red Oak Cir Unit 406
- 1316 N Red Oak Cir Unit 2
- 1543 W Remington Ln
- 1376 W Split Oak Cir
- 1248 N Red Oak Cir Unit 2
- 649 N Fox Trail
- 1110 N Fairfield Rd
- 915 Mayfield Dr
- 1506 Spring Brook Ct Unit 1F
- 1508 Spring Brook Ct Unit 3
- 1508 Spring Brook Ct Unit 3D
- 1508 Spring Brook Ct Unit 2D
- 1508 Spring Brook Ct Unit 1D
- 1508 Spring Brook Ct Unit 2C
- 1508 Spring Brook Ct Unit 1
- 1508 Spring Brook Ct Unit 2B
- 1508 Spring Brook Ct Unit CT15081
- 1508 Spring Brook Ct Unit 3
- 1508 Spring Brook Ct Unit 2A
- 1508 Spring Brook Ct Unit 1A
- 1506 Spring Brook Ct Unit 2F
- 1506 Spring Brook Ct Unit CT15062
- 1506 Spring Brook Ct Unit CT15061
- 1506 Spring Brook Ct Unit CT15062
- 1506 Spring Brook Ct Unit CT15061
- 1506 Spring Brook Ct Unit CT15062
- 1506 Spring Brook Ct Unit 1
- 1506 Spring Brook Ct Unit 1G