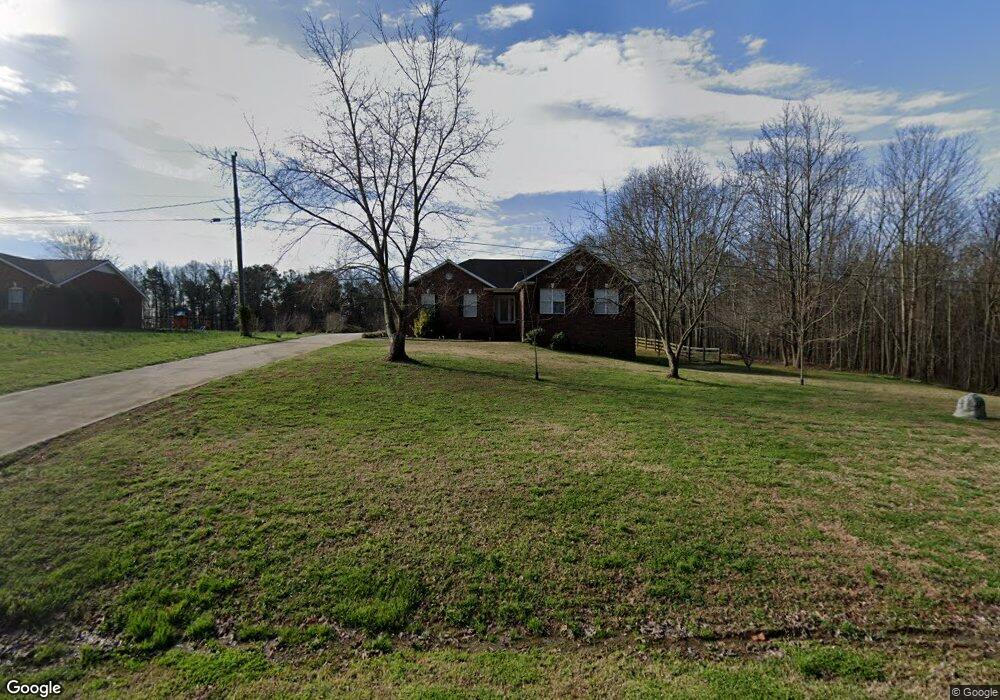
1508 Tom Helms Rd Monroe, NC 28110
Estimated Value: $426,000 - $490,929
Studio
2
Baths
1,805
Sq Ft
$254/Sq Ft
Est. Value
About This Home
This home is located at 1508 Tom Helms Rd, Monroe, NC 28110 and is currently estimated at $458,732, approximately $254 per square foot. 1508 Tom Helms Rd is a home located in Union County with nearby schools including Unionville Elementary School, Piedmont Middle School, and Piedmont High School.
Ownership History
Date
Name
Owned For
Owner Type
Purchase Details
Closed on
Jun 28, 2019
Sold by
Wallace Mark E and Wallace Connie S
Bought by
Daniel David R and Daniel Amy T
Current Estimated Value
Purchase Details
Closed on
Jun 11, 2010
Sold by
Pnc Mortgage
Bought by
Wallace Mark E and Wallace Connie S
Home Financials for this Owner
Home Financials are based on the most recent Mortgage that was taken out on this home.
Original Mortgage
$135,200
Interest Rate
4.91%
Mortgage Type
New Conventional
Purchase Details
Closed on
Mar 9, 2010
Sold by
Mumpower David Wayne and Mumpower Elizabeth
Bought by
Pnc Mortgage
Purchase Details
Closed on
Dec 28, 1999
Sold by
Mcgee Brothers Co Inc
Bought by
Farr Mumpower David Wayne and Farr Mumpower Elizabeth
Home Financials for this Owner
Home Financials are based on the most recent Mortgage that was taken out on this home.
Original Mortgage
$139,000
Interest Rate
7.68%
Create a Home Valuation Report for This Property
The Home Valuation Report is an in-depth analysis detailing your home's value as well as a comparison with similar homes in the area
Home Values in the Area
Average Home Value in this Area
Purchase History
| Date | Buyer | Sale Price | Title Company |
|---|---|---|---|
| Daniel David R | $291,000 | None Available | |
| Wallace Mark E | $169,000 | None Available | |
| Pnc Mortgage | $167,200 | None Available | |
| Farr Mumpower David Wayne | $158,500 | -- |
Source: Public Records
Mortgage History
| Date | Status | Borrower | Loan Amount |
|---|---|---|---|
| Previous Owner | Wallace Mark E | $135,200 | |
| Previous Owner | Farr Mumpower David Wayne | $139,000 |
Source: Public Records
Tax History
| Year | Tax Paid | Tax Assessment Tax Assessment Total Assessment is a certain percentage of the fair market value that is determined by local assessors to be the total taxable value of land and additions on the property. | Land | Improvement |
|---|---|---|---|---|
| 2025 | $2,559 | $503,600 | $0 | $0 |
| 2024 | $2,418 | $357,900 | $36,600 | $321,300 |
| 2023 | $2,396 | $357,900 | $36,600 | $321,300 |
| 2022 | $2,324 | $357,900 | $36,600 | $321,300 |
| 2021 | $2,397 | $357,900 | $36,600 | $321,300 |
| 2020 | $2,025 | $260,930 | $25,630 | $235,300 |
| 2019 | $2,059 | $260,930 | $25,630 | $235,300 |
| 2018 | $2,007 | $260,930 | $25,630 | $235,300 |
| 2017 | $2,138 | $260,900 | $25,600 | $235,300 |
| 2016 | $2,100 | $260,930 | $25,630 | $235,300 |
| 2015 | $2,126 | $260,930 | $25,630 | $235,300 |
| 2014 | $1,476 | $237,930 | $30,170 | $207,760 |
Source: Public Records
Map
Nearby Homes
- 0 Sikes Mill Rd Unit CAR4186382
- 2820 Loxdale Farms Dr Unit 14
- 1400 Henry Smith Rd
- 1307 N Hills Dr
- 0 Unionville Rd
- 5604 Unionville Rd
- 2709 Smith Field Dr
- 2820 Smith Field Dr
- 5803 Morgan Mill Rd
- 2608 Wild Azalea Ct
- 2605 Wild Azalea Ct
- 5509 Morgan Mill Rd
- 1600 Thornhill Dr
- 122 E Cj Thomas Rd
- 3211 Old Camden Rd
- 1131 Sikes Mill Rd
- 4010 Concord Hwy
- 5816 Concord Hwy
- 835 Sikes Mill Rd
- 835 & 837 Sikes Mill Rd
- 1508 Tom Helms Rd
- 1504 Tom Helms Rd
- 1500 Tom Helms Rd
- 1521 Tom Helms Rd
- 000 Tom Helms Rd
- 1417 Tom Helms Rd
- 0 Sikes Mill Rd Unit 9596807
- 0 Sikes Mill Rd Unit 3339358
- 0 Sikes Mill Rd Unit CAR3892029
- 0 Sikes Mill Rd Unit 3714596
- 1411 Tom Helms Rd
- 1404 Tom Helms Rd
- 2614 Sikes Mill Rd
- 2807 Sikes Mill Rd
- 2700 Loxdale Farms Dr
- 1608 Erindale Ct
- 2704 Loxdale Farms Dr
- 1604 Erindale Ct
- 2809 Sikes Mill Rd
- 1819 E Lawyers Rd
Your Personal Tour Guide
Ask me questions while you tour the home.