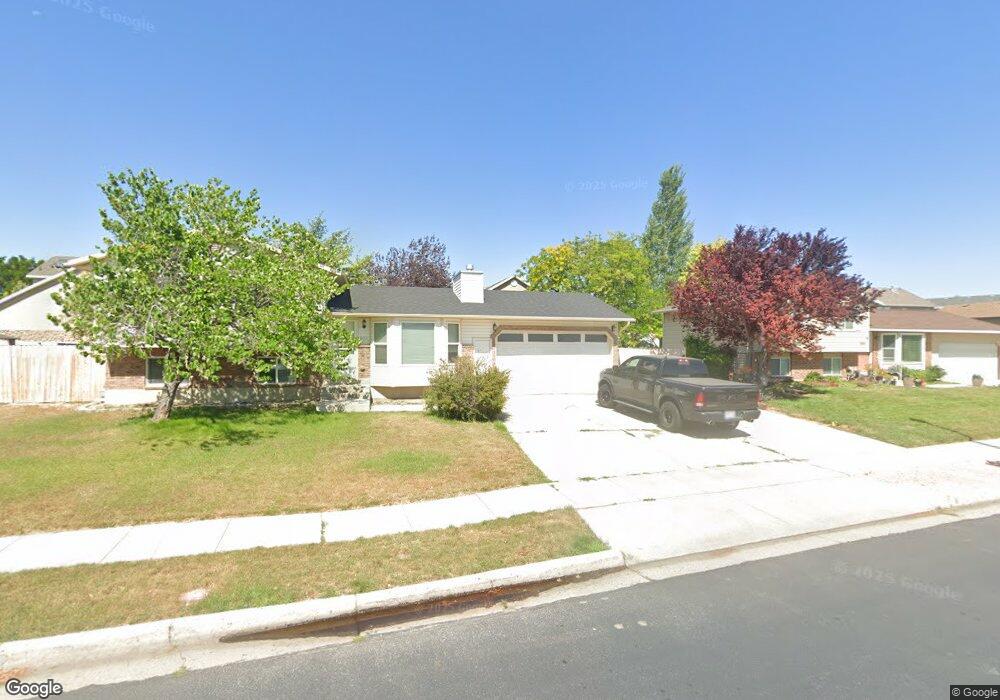
1508 Turtle Dove Ln West Jordan, UT 84088
Estimated Value: $482,000 - $547,000
4
Beds
2
Baths
1,079
Sq Ft
$484/Sq Ft
Est. Value
About This Home
This home is located at 1508 Turtle Dove Ln, West Jordan, UT 84088 and is currently estimated at $522,573, approximately $484 per square foot. 1508 Turtle Dove Ln is a home located in Salt Lake County with nearby schools including Riverside Elementary School, West Jordan Middle School, and West Jordan High School.
Ownership History
Date
Name
Owned For
Owner Type
Purchase Details
Closed on
Sep 3, 2019
Sold by
Jacketta Bonnie J
Bought by
Woods Annis E and Anis E Woods Revocable Living Trust
Current Estimated Value
Purchase Details
Closed on
Jun 11, 2015
Sold by
Jacketta Bonnie
Bought by
Jacketta Bonnie J
Purchase Details
Closed on
Mar 18, 2013
Sold by
Jacketta Bonnie J
Bought by
Jacketta Bonnie and Bonnie Jacketta Living Trust
Purchase Details
Closed on
Feb 20, 2007
Sold by
Marlowe Deidre
Bought by
Jacketta Bonnie J
Home Financials for this Owner
Home Financials are based on the most recent Mortgage that was taken out on this home.
Original Mortgage
$70,000
Interest Rate
6.21%
Mortgage Type
Unknown
Purchase Details
Closed on
Oct 28, 2002
Sold by
Jordan Development Llc
Bought by
Majestic Homes Inc
Create a Home Valuation Report for This Property
The Home Valuation Report is an in-depth analysis detailing your home's value as well as a comparison with similar homes in the area
Home Values in the Area
Average Home Value in this Area
Purchase History
| Date | Buyer | Sale Price | Title Company |
|---|---|---|---|
| Woods Annis E | -- | Bay National Title Company | |
| Jacketta Bonnie J | -- | Integrity Title Ins Svcs | |
| Jacketta Bonnie | -- | None Available | |
| Jacketta Bonnie J | -- | Integrated Title Ins Svcs | |
| Majestic Homes Inc | -- | Integrated Title Ins Service |
Source: Public Records
Mortgage History
| Date | Status | Borrower | Loan Amount |
|---|---|---|---|
| Previous Owner | Jacketta Bonnie J | $70,000 |
Source: Public Records
Tax History Compared to Growth
Tax History
| Year | Tax Paid | Tax Assessment Tax Assessment Total Assessment is a certain percentage of the fair market value that is determined by local assessors to be the total taxable value of land and additions on the property. | Land | Improvement |
|---|---|---|---|---|
| 2025 | $2,448 | $485,100 | $125,100 | $360,000 |
| 2024 | $2,448 | $470,900 | $123,800 | $347,100 |
| 2023 | $2,538 | $460,200 | $89,100 | $371,100 |
| 2022 | $2,589 | $461,900 | $87,400 | $374,500 |
| 2021 | $2,096 | $340,400 | $65,500 | $274,900 |
| 2020 | $1,956 | $298,100 | $65,500 | $232,600 |
| 2019 | $1,874 | $280,100 | $65,500 | $214,600 |
| 2018 | $1,760 | $260,900 | $64,600 | $196,300 |
| 2017 | $1,655 | $244,200 | $64,600 | $179,600 |
| 2016 | $1,755 | $243,400 | $64,600 | $178,800 |
| 2015 | $1,693 | $228,900 | $65,900 | $163,000 |
| 2014 | $1,626 | $216,400 | $62,800 | $153,600 |
Source: Public Records
Map
Nearby Homes
- 1633 W Rockaway Ln
- 1424 Stone Meadow Dr
- 1352 W 8780 S
- 1401 W Stone Meadow Dr
- 1434 Autumn Oak Cir
- 8686 S Temple Dr
- 1773 W 8760 S
- 8534 S Redwood Rd
- 8518 S Redwood Rd
- 8510 S Redwood Rd
- 1254 W 8680 S
- 8843 Capernaum Rd
- 8772 S Midvalley Dr
- 9141 S Little Creek Dr
- 2041 W 8820 S
- 1689 W 8295 S Unit 2
- 8713 Mountain Meadow Dr
- 8686 Covewood Place
- 8859 S Long Dr
- 1184 W Michaelsen Way
- 1508 W Turtle Dove Ln
- 1514 Turtle Dove Ln
- 1514 W Turtle Dove Ln
- 8693 Dove Meadows Ln
- 8712 S 1480 W
- 8698 S 1480 W
- 1507 Turtle Dove Ln
- 8689 Dove Meadows Ln
- 8689 Dove Meadows Ln Unit 114
- 8689 S Dove Meadows Ln
- 1513 W Turtle Dove Ln
- 1513 Turtle Dove Ln
- 8724 S 1480 W
- 1519 W Turtle Dove Ln
- 1519 W Turtle Dove Ln Unit 1519
- 1519 Turtle Dove Ln
- 1528 Turtle Dove Ln
- 8682 S 1480 W
- 1528 W Turtle Dove Ln
- 8681 Dove Meadows Ln