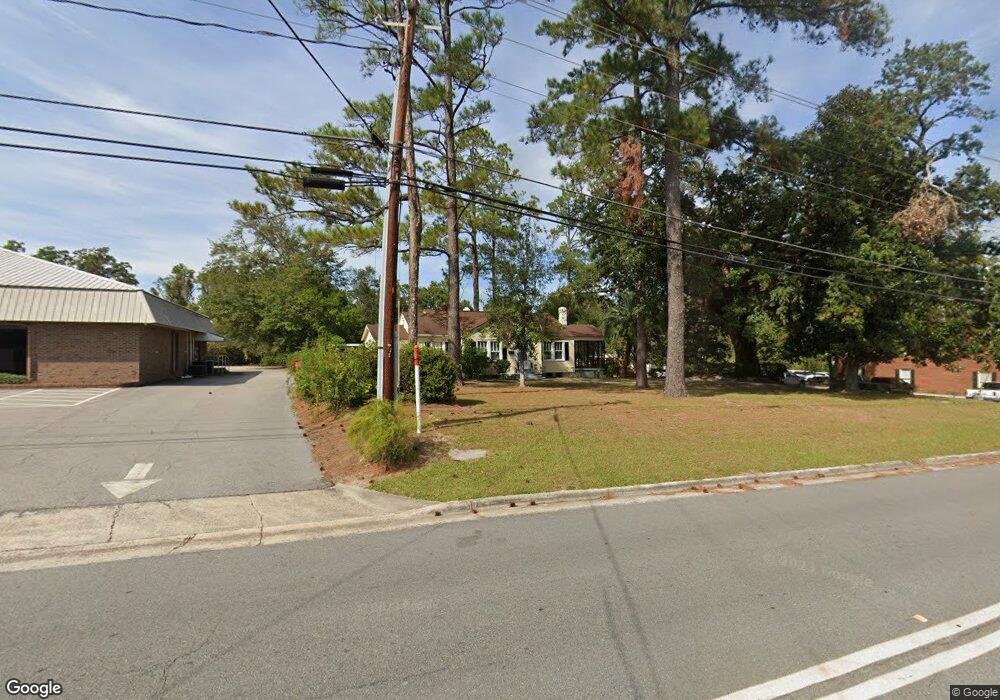
1509 Alice St Waycross, GA 31501
Estimated Value: $127,000 - $165,000
2
Beds
1
Bath
1,354
Sq Ft
$107/Sq Ft
Est. Value
About This Home
This home is located at 1509 Alice St, Waycross, GA 31501 and is currently estimated at $144,667, approximately $106 per square foot. 1509 Alice St is a home located in Ware County with nearby schools including Center Elementary School, Waycross Middle School, and Ware County High School.
Ownership History
Date
Name
Owned For
Owner Type
Purchase Details
Closed on
Jan 12, 2023
Sold by
Pleasant Financial Holdings Llc
Bought by
Medical Treatment Consultants Llc
Current Estimated Value
Purchase Details
Closed on
May 29, 2020
Sold by
Davenport Jeffrey P
Bought by
Pleasant Financial Holdings Llc
Purchase Details
Closed on
Oct 4, 2018
Sold by
Ware Childrens Initiative Inc
Bought by
Davenport Jeffrey P
Home Financials for this Owner
Home Financials are based on the most recent Mortgage that was taken out on this home.
Original Mortgage
$77,747
Interest Rate
4.5%
Mortgage Type
Commercial
Purchase Details
Closed on
Jan 11, 2016
Sold by
Booker Daniel C
Bought by
Ware Childrens Initiative Inc
Purchase Details
Closed on
Jan 24, 2001
Sold by
Satilla Reginal Canc
Bought by
Booker Daniel C
Purchase Details
Closed on
Jun 22, 1994
Bought by
Satilla Reginal Canc
Create a Home Valuation Report for This Property
The Home Valuation Report is an in-depth analysis detailing your home's value as well as a comparison with similar homes in the area
Home Values in the Area
Average Home Value in this Area
Purchase History
| Date | Buyer | Sale Price | Title Company |
|---|---|---|---|
| Medical Treatment Consultants Llc | $120,000 | -- | |
| Pleasant Financial Holdings Llc | -- | -- | |
| Davenport Jeffrey P | $89,500 | -- | |
| Ware Childrens Initiative Inc | -- | -- | |
| Booker Daniel C | $100,000 | -- | |
| Satilla Reginal Canc | $60,000 | -- |
Source: Public Records
Mortgage History
| Date | Status | Borrower | Loan Amount |
|---|---|---|---|
| Previous Owner | Davenport Jeffrey P | $77,747 |
Source: Public Records
Tax History Compared to Growth
Tax History
| Year | Tax Paid | Tax Assessment Tax Assessment Total Assessment is a certain percentage of the fair market value that is determined by local assessors to be the total taxable value of land and additions on the property. | Land | Improvement |
|---|---|---|---|---|
| 2024 | $1,520 | $46,488 | $3,000 | $43,488 |
| 2023 | $1,603 | $51,246 | $30,492 | $20,754 |
| 2022 | $2,042 | $51,246 | $30,492 | $20,754 |
| 2021 | $2,096 | $48,465 | $30,492 | $17,973 |
| 2020 | $2,082 | $47,760 | $30,492 | $17,268 |
| 2019 | $1,583 | $48,670 | $30,492 | $18,178 |
| 2018 | $0 | $47,564 | $30,492 | $17,072 |
| 2017 | $2,086 | $47,564 | $30,492 | $17,072 |
| 2016 | $2,086 | $47,838 | $30,492 | $17,346 |
| 2015 | $2,187 | $49,808 | $30,492 | $19,316 |
| 2014 | $2,185 | $49,808 | $30,492 | $19,316 |
| 2013 | -- | $49,808 | $30,492 | $19,316 |
Source: Public Records
Map
Nearby Homes
- 1504 Habersham Dr
- 1405 Grove Ave
- 301 Riverside Dr
- .22 Alice St
- 511 Riverside Dr
- 310 Butler St
- 0 Beville St
- 807 College St
- 2022 Pioneer St
- 00 Pineview Dr
- 0 Pineview Dr
- 511 Richmond Ave
- 1701 Satilla Blvd
- 415 Dewey St
- 1101 Cherokee Dr
- 1301 Riverside Ave
- 502 Dewey St
- 506 Magnolia Dr
- 2120 Tebeau St
- 812 Effie St