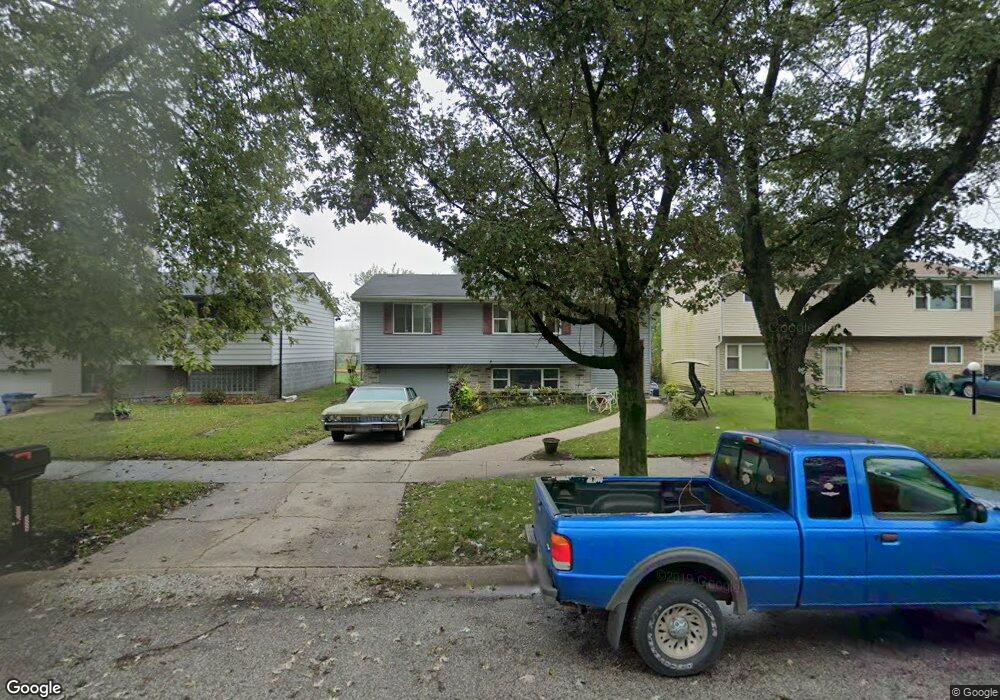
1509 Calhoun St Gary, IN 46406
Westside NeighborhoodEstimated Value: $100,000 - $168,000
3
Beds
1
Bath
1,808
Sq Ft
$76/Sq Ft
Est. Value
About This Home
This home is located at 1509 Calhoun St, Gary, IN 46406 and is currently estimated at $136,593, approximately $75 per square foot. 1509 Calhoun St is a home located in Lake County with nearby schools including Bailly Preparatory Academy, West Side Leadership Academy, and Aspire Charter Academy.
Ownership History
Date
Name
Owned For
Owner Type
Purchase Details
Closed on
Jul 9, 2024
Sold by
Batiste Lawrence
Bought by
Batiste Lawrence and Batiste Sharon
Current Estimated Value
Purchase Details
Closed on
Dec 30, 2014
Sold by
Batiste Sharon Kaye
Bought by
Batiste Lawrence
Purchase Details
Closed on
Dec 15, 2014
Sold by
Batiste Sharon
Bought by
Batiste Lawrence
Purchase Details
Closed on
May 8, 2014
Sold by
Batiste Sharon
Bought by
Batiste Lawrence
Purchase Details
Closed on
Sep 24, 2007
Sold by
Batiste Lawrence
Bought by
Batiste Sharon Kaye
Purchase Details
Closed on
Jun 26, 2006
Sold by
Ballinger Ronald J
Bought by
Batiste Lawrence
Home Financials for this Owner
Home Financials are based on the most recent Mortgage that was taken out on this home.
Original Mortgage
$74,800
Interest Rate
10.75%
Mortgage Type
Purchase Money Mortgage
Create a Home Valuation Report for This Property
The Home Valuation Report is an in-depth analysis detailing your home's value as well as a comparison with similar homes in the area
Home Values in the Area
Average Home Value in this Area
Purchase History
| Date | Buyer | Sale Price | Title Company |
|---|---|---|---|
| Batiste Lawrence | -- | None Listed On Document | |
| Batiste Lawrence | -- | None Available | |
| Batiste Lawrence | -- | None Available | |
| Batiste Lawrence | -- | None Available | |
| Batiste Sharon Kaye | -- | None Available | |
| Batiste Lawrence | -- | Ticor Hbt |
Source: Public Records
Mortgage History
| Date | Status | Borrower | Loan Amount |
|---|---|---|---|
| Previous Owner | Batiste Lawrence | $74,800 |
Source: Public Records
Tax History
| Year | Tax Paid | Tax Assessment Tax Assessment Total Assessment is a certain percentage of the fair market value that is determined by local assessors to be the total taxable value of land and additions on the property. | Land | Improvement |
|---|---|---|---|---|
| 2025 | $60 | $58,900 | $5,900 | $53,000 |
| 2024 | $5,114 | $55,200 | $5,900 | $49,300 |
| 2023 | $126 | $58,000 | $5,900 | $52,100 |
| 2021 | $126 | $51,300 | $5,200 | $46,100 |
| 2020 | $126 | $51,300 | $5,200 | $46,100 |
| 2019 | $60 | $47,800 | $5,200 | $42,600 |
| 2018 | $60 | $52,000 | $5,200 | $46,800 |
| 2017 | $60 | $51,400 | $5,000 | $46,400 |
| 2016 | $60 | $77,100 | $5,000 | $72,100 |
| 2014 | -- | $83,100 | $5,800 | $77,300 |
| 2013 | $1,849 | $82,300 | $5,900 | $76,400 |
Source: Public Records
Map
Nearby Homes
- 5438 W 15th Ave
- 349 Hamlin St
- 1528 Hanley St
- 1755 Ralston St
- 1035 Clinton St
- 1024 Ralston St Unit 30
- 1045 - 1051 Durbin St
- 1831 Burr St
- 880 Gerry St
- 984 Stevenson St
- 1152 Hovey St
- 2012 Hovey Place
- 2001 Hovey Place
- 945 - 949 Clark Rd
- 2320 Burr St
- 4429 W 13th Ave
- 2321 Burr St
- 2327 Burr St
- 621 Burr St
- 1961 Williams St
- 1501 Calhoun St
- 1517 Calhoun St
- 5829 W 15th Ave
- 1525 Calhoun St
- 1508 Tompkins St
- 1500 Tompkins St
- 1533 Calhoun St
- 1516 Tompkins St Unit 22
- 1524 Tompkins St
- 1541 Calhoun St
- 1532 Tompkins St
- 1540 Tompkins St
- 1549 Calhoun St
- 1548 Tompkins St
- 1501 Tompkins St
- 1517 Tompkins St
- 1556 Tompkins St
- 1525 Tompkins St
- 1565 Calhoun St
- 1533 Tompkins St
Your Personal Tour Guide
Ask me questions while you tour the home.