Estimated Value: $261,409 - $291,000
4
Beds
2
Baths
1,184
Sq Ft
$236/Sq Ft
Est. Value
About This Home
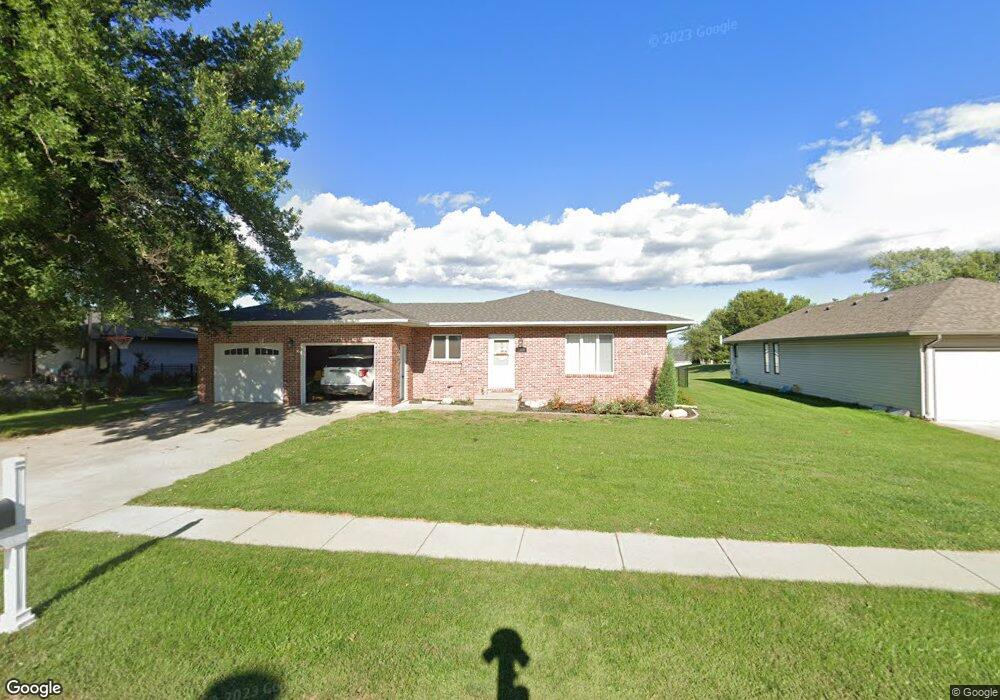
This home is located at 1509 Claycomb Rd, Wayne, NE 68787 and is currently estimated at $279,102, approximately $235 per square foot. 1509 Claycomb Rd is a home located in Wayne County with nearby schools including Wayne Elementary School, Wayne High School, and St. Mary Elementary School.
Ownership History
Date
Name
Owned For
Owner Type
Purchase Details
Closed on
May 23, 2021
Sold by
Reynolds Troy L and Reynolds Stephanie A
Bought by
Rastede Wayne M and Rastede Mary E
Current Estimated Value
Purchase Details
Closed on
Jun 17, 2010
Sold by
Blecke Wesley A and Blecke Andrea E
Bought by
Reynolds Troy L and Reynolds Stephanie A
Home Financials for this Owner
Home Financials are based on the most recent Mortgage that was taken out on this home.
Original Mortgage
$105,000
Interest Rate
4.93%
Mortgage Type
New Conventional
Purchase Details
Closed on
Nov 7, 2005
Sold by
Havrda Duane
Bought by
Blecke Wesley A and Blecke Andrea E
Home Financials for this Owner
Home Financials are based on the most recent Mortgage that was taken out on this home.
Original Mortgage
$82,400
Interest Rate
5.75%
Mortgage Type
New Conventional
Create a Home Valuation Report for This Property
The Home Valuation Report is an in-depth analysis detailing your home's value as well as a comparison with similar homes in the area
Home Values in the Area
Average Home Value in this Area
Purchase History
We collect this data history from publicly available records. To have your information removed, we recommend requesting removal directly through your county’s website.
| Date | Buyer | Sale Price | Title Company |
|---|---|---|---|
| Rastede Wayne M | $200,000 | None Available | |
| Reynolds Troy L | $150,000 | -- | |
| Blecke Wesley A | $103,000 | None Available |
Source: Public Records
Mortgage History
We collect this data history from publicly available records. To have your information removed, we recommend requesting removal directly through your county’s website.
| Date | Status | Borrower | Loan Amount |
|---|---|---|---|
| Previous Owner | Reynolds Troy L | $105,000 | |
| Previous Owner | Blecke Wesley A | $82,400 |
Source: Public Records
Tax History
| Year | Tax Paid | Tax Assessment Tax Assessment Total Assessment is a certain percentage of the fair market value that is determined by local assessors to be the total taxable value of land and additions on the property. | Land | Improvement |
|---|---|---|---|---|
| 2025 | $3,096 | $246,040 | $23,535 | $222,505 |
| 2024 | $2,788 | $219,835 | $22,950 | $196,885 |
| 2023 | $3,337 | $196,210 | $22,950 | $173,260 |
| 2022 | $2,884 | $165,295 | $15,660 | $149,635 |
| 2021 | $2,810 | $154,110 | $15,660 | $138,450 |
| 2020 | $2,757 | $154,110 | $15,660 | $138,450 |
| 2019 | $2,370 | $134,330 | $15,660 | $118,670 |
| 2018 | $2,408 | $134,330 | $15,660 | $118,670 |
| 2017 | $2,388 | $134,715 | $15,660 | $119,055 |
| 2016 | $2,525 | $0 | $0 | $0 |
| 2015 | $2,468 | $134,715 | $15,660 | $119,055 |
| 2014 | -- | $135,655 | $15,150 | $120,505 |
| 2013 | -- | $135,655 | $15,150 | $120,505 |
Source: Public Records
Map
Nearby Homes
- 908 Aspen St
- 912 Aspen St
- 1501 Claycomb Rd
- 1505 Claycomb Rd
- 1422 Linden St
- 1004 Aspen St
- 1425 Claycomb Rd
- 1418 Linden St
- 1513 Claycomb Rd
- 1421 Claycomb Rd
- 1467 Linden St
- 1504 Claycomb Rd
- 1500 Claycomb Rd
- 1515 Claycomb Rd
- 1417 Claycomb Rd
- 1508 Claycomb Rd
- 1414 Linden St
- 1422 Claycomb Rd
- 1005 Aspen St
- 1459 Linden St
Your Personal Tour Guide
Ask me questions while you tour the home.