Estimated Value: $231,828 - $247,000
--
Bed
2
Baths
1,589
Sq Ft
$150/Sq Ft
Est. Value
About This Home
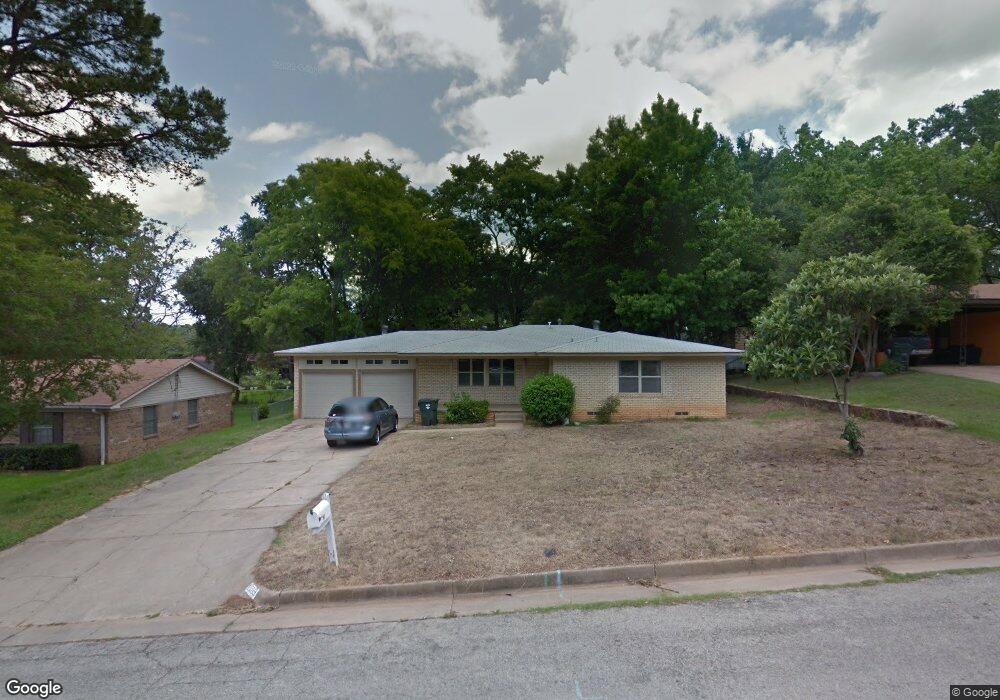
This home is located at 1509 Crockett Dr, Tyler, TX 75701 and is currently estimated at $237,707, approximately $149 per square foot. 1509 Crockett Dr is a home located in Smith County with nearby schools including Birdwell Dual Language Immersion School, Hogg Middle School, and Tyler Legacy High School.
Ownership History
Date
Name
Owned For
Owner Type
Purchase Details
Closed on
Mar 18, 2016
Sold by
Brandt Jonathan and Brandt Melissa
Bought by
Martinez Colunga Francisco
Current Estimated Value
Home Financials for this Owner
Home Financials are based on the most recent Mortgage that was taken out on this home.
Original Mortgage
$115,500
Outstanding Balance
$85,163
Interest Rate
4.37%
Mortgage Type
Adjustable Rate Mortgage/ARM
Estimated Equity
$152,544
Purchase Details
Closed on
Mar 13, 2012
Sold by
The Secretary Of Housing & Urban Develop
Bought by
Brandt Jonathan and Brandt Melissa
Purchase Details
Closed on
Aug 23, 2011
Sold by
Hsbc Bank Usa National Association
Bought by
Secretary Of Housing & Urban Development
Purchase Details
Closed on
Nov 19, 2004
Sold by
Wilson Broderick L and Wilson Temeka R
Bought by
Hsbc Bank Usa National Association
Create a Home Valuation Report for This Property
The Home Valuation Report is an in-depth analysis detailing your home's value as well as a comparison with similar homes in the area
Home Values in the Area
Average Home Value in this Area
Purchase History
| Date | Buyer | Sale Price | Title Company |
|---|---|---|---|
| Martinez Colunga Francisco | -- | None Available | |
| Brandt Jonathan | -- | None Available | |
| Secretary Of Housing & Urban Development | -- | None Available | |
| Hsbc Bank Usa National Association | $94,490 | None Available |
Source: Public Records
Mortgage History
| Date | Status | Borrower | Loan Amount |
|---|---|---|---|
| Open | Martinez Colunga Francisco | $115,500 |
Source: Public Records
Tax History Compared to Growth
Tax History
| Year | Tax Paid | Tax Assessment Tax Assessment Total Assessment is a certain percentage of the fair market value that is determined by local assessors to be the total taxable value of land and additions on the property. | Land | Improvement |
|---|---|---|---|---|
| 2025 | $2,377 | $221,599 | $34,582 | $187,017 |
| 2024 | $2,377 | $207,219 | $17,850 | $189,369 |
| 2023 | $3,108 | $178,319 | $17,850 | $160,469 |
| 2022 | $2,821 | $144,005 | $17,850 | $126,155 |
| 2021 | $2,826 | $134,718 | $17,850 | $116,868 |
| 2020 | $2,864 | $133,865 | $17,850 | $116,015 |
| 2019 | $2,408 | $110,141 | $15,470 | $94,671 |
| 2018 | $2,156 | $99,148 | $11,900 | $87,248 |
| 2017 | $2,117 | $99,148 | $11,900 | $87,248 |
| 2016 | $2,034 | $95,279 | $11,900 | $83,379 |
| 2015 | $1,663 | $91,715 | $11,900 | $79,815 |
| 2014 | $1,663 | $88,897 | $11,900 | $76,997 |
Source: Public Records
Map
Nearby Homes
- 1506 Bowie Dr
- 2922 W Azalea Dr
- 1209 Terre Haute Dr
- 1672 Alamo Crossing
- 3045 Concord Place
- 3048 Concord Place
- 2900 S Robertson Ave
- 2809 S Robertson Ave
- 1314 S Azalea Dr
- 3413 Iberville Dr
- 789 Fairmont Dr
- 1408 Old Noonday Rd
- 1111 Beechwood Dr
- 2529 S Vine Ave
- 2715 S Robertson Ave
- 3426 Bienville Dr
- 2525 S Vine Ave
- 3425 Iberville Dr
- 2922 Frankston Hwy
- 2521 S Vine Ave
- 1509 1509 Crockett Dr
- 1515 Crockett Dr
- 1503 Crockett Dr
- 1500 1500 Alamo Dr
- 1516 Alamo Dr
- 1418 Alamo Dr
- 1521 1521 Crockett Dr
- 1521 Crockett Dr
- 1508 Crockett Dr
- 1421 Crockett Dr
- 1508 1508 Crockett
- 1506 Crockett Dr
- 1522 Alamo Dr
- 1500 1500 Crockett
- 1412 Alamo Dr
- 1500 Crockett Dr
- 1524 Crockett Dr
- 1525 Crockett Dr
- 1411 1411 Crockett
- 1526 Alamo Dr