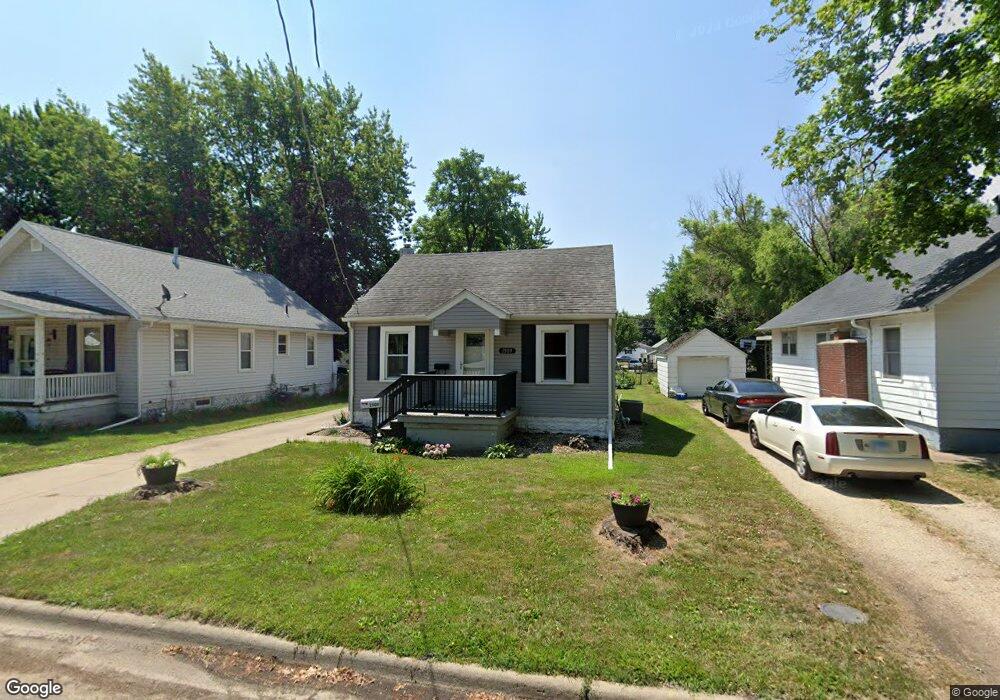
1509 E 15th St Sterling, IL 61081
Estimated Value: $63,152 - $89,000
2
Beds
1
Bath
636
Sq Ft
$122/Sq Ft
Est. Value
About This Home
This home is located at 1509 E 15th St, Sterling, IL 61081 and is currently estimated at $77,788, approximately $122 per square foot. 1509 E 15th St is a home located in Whiteside County with nearby schools including Christ Lutheran School.
Ownership History
Date
Name
Owned For
Owner Type
Purchase Details
Closed on
Jul 29, 2011
Sold by
Osborn Randolph and Osborn Nancy
Bought by
Knutti Kara N
Current Estimated Value
Home Financials for this Owner
Home Financials are based on the most recent Mortgage that was taken out on this home.
Original Mortgage
$53,300
Outstanding Balance
$36,818
Interest Rate
4.52%
Mortgage Type
New Conventional
Estimated Equity
$40,970
Purchase Details
Closed on
Nov 17, 2010
Sold by
Citimortgage Inc
Bought by
Osborn Randolph and Osborn Nancy
Purchase Details
Closed on
Aug 2, 2010
Sold by
Jordan Candace S
Bought by
Citimortgage Inc
Purchase Details
Closed on
Mar 30, 2005
Sold by
Bollman Anthony L and Bollman Carmen C
Bought by
Jordan Candace Se
Home Financials for this Owner
Home Financials are based on the most recent Mortgage that was taken out on this home.
Original Mortgage
$50,000
Interest Rate
5.88%
Mortgage Type
New Conventional
Create a Home Valuation Report for This Property
The Home Valuation Report is an in-depth analysis detailing your home's value as well as a comparison with similar homes in the area
Home Values in the Area
Average Home Value in this Area
Purchase History
| Date | Buyer | Sale Price | Title Company |
|---|---|---|---|
| Knutti Kara N | $51,500 | None Available | |
| Osborn Randolph | $20,000 | None Available | |
| Citimortgage Inc | -- | None Available | |
| Jordan Candace Se | $50,000 | None Available |
Source: Public Records
Mortgage History
| Date | Status | Borrower | Loan Amount |
|---|---|---|---|
| Open | Knutti Kara N | $53,300 | |
| Previous Owner | Jordan Candace Se | $50,000 |
Source: Public Records
Tax History
| Year | Tax Paid | Tax Assessment Tax Assessment Total Assessment is a certain percentage of the fair market value that is determined by local assessors to be the total taxable value of land and additions on the property. | Land | Improvement |
|---|---|---|---|---|
| 2024 | $1,401 | $19,432 | $2,934 | $16,498 |
| 2023 | $1,283 | $18,241 | $2,754 | $15,487 |
| 2022 | $1,224 | $17,452 | $2,635 | $14,817 |
| 2021 | $1,143 | $16,458 | $2,485 | $13,973 |
| 2020 | $1,089 | $15,882 | $2,398 | $13,484 |
| 2019 | $1,069 | $15,593 | $2,354 | $13,239 |
| 2018 | $1,059 | $15,618 | $2,358 | $13,260 |
| 2017 | $1,057 | $15,511 | $2,342 | $13,169 |
| 2016 | $1,008 | $15,012 | $2,267 | $12,745 |
| 2015 | $981 | $15,425 | $2,330 | $13,095 |
| 2014 | $965 | $15,082 | $2,278 | $12,804 |
| 2013 | $981 | $15,425 | $2,330 | $13,095 |
Source: Public Records
Map
Nearby Homes
Your Personal Tour Guide
Ask me questions while you tour the home.