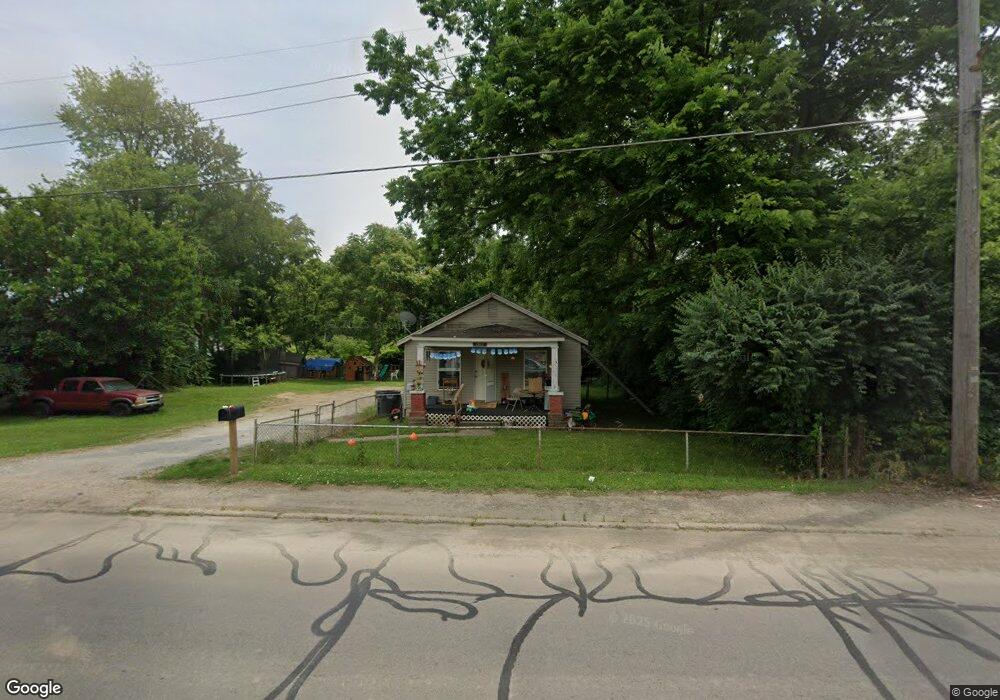
1509 E 18th St Anderson, IN 46016
Estimated Value: $63,404 - $81,000
2
Beds
1
Bath
748
Sq Ft
$97/Sq Ft
Est. Value
About This Home
This home is located at 1509 E 18th St, Anderson, IN 46016 and is currently estimated at $72,351, approximately $96 per square foot. 1509 E 18th St is a home located in Madison County with nearby schools including Tenth Street Elementary School, Highland Middle School, and Anderson High School.
Ownership History
Date
Name
Owned For
Owner Type
Purchase Details
Closed on
Jun 3, 2024
Sold by
Brown Lee Roy
Bought by
Pease Makayla
Current Estimated Value
Home Financials for this Owner
Home Financials are based on the most recent Mortgage that was taken out on this home.
Original Mortgage
$55,290
Outstanding Balance
$54,460
Interest Rate
7.17%
Mortgage Type
New Conventional
Estimated Equity
$17,891
Purchase Details
Closed on
Mar 8, 2011
Sold by
Secretary Of Hud Of Washington
Bought by
Brown Lee Roy
Purchase Details
Closed on
Aug 18, 2009
Sold by
Chase Home Finance Llc
Bought by
Secretary Of Hud
Purchase Details
Closed on
Aug 14, 2009
Sold by
Collier Robert and Kreps Steve
Bought by
Chase Home Finance Llc
Purchase Details
Closed on
Feb 26, 2007
Sold by
Cornerstone Baptist Church Of Anderson
Bought by
Collier Robert
Home Financials for this Owner
Home Financials are based on the most recent Mortgage that was taken out on this home.
Original Mortgage
$40,366
Interest Rate
6.27%
Mortgage Type
FHA
Create a Home Valuation Report for This Property
The Home Valuation Report is an in-depth analysis detailing your home's value as well as a comparison with similar homes in the area
Home Values in the Area
Average Home Value in this Area
Purchase History
| Date | Buyer | Sale Price | Title Company |
|---|---|---|---|
| Pease Makayla | $57,000 | None Listed On Document | |
| Brown Lee Roy | -- | -- | |
| Secretary Of Hud | -- | -- | |
| Chase Home Finance Llc | $46,720 | -- | |
| Collier Robert | -- | -- |
Source: Public Records
Mortgage History
| Date | Status | Borrower | Loan Amount |
|---|---|---|---|
| Open | Pease Makayla | $55,290 | |
| Previous Owner | Collier Robert | $40,366 |
Source: Public Records
Tax History
| Year | Tax Paid | Tax Assessment Tax Assessment Total Assessment is a certain percentage of the fair market value that is determined by local assessors to be the total taxable value of land and additions on the property. | Land | Improvement |
|---|---|---|---|---|
| 2025 | $687 | $34,700 | $4,800 | $29,900 |
| 2024 | $687 | $30,900 | $4,800 | $26,100 |
| 2023 | $631 | $28,200 | $4,500 | $23,700 |
| 2022 | $631 | $28,200 | $4,300 | $23,900 |
| 2021 | $587 | $26,100 | $4,300 | $21,800 |
| 2020 | $560 | $24,800 | $4,100 | $20,700 |
| 2019 | $547 | $24,200 | $4,100 | $20,100 |
| 2018 | $522 | $22,600 | $4,100 | $18,500 |
| 2017 | $446 | $22,300 | $4,100 | $18,200 |
| 2016 | $446 | $22,300 | $4,100 | $18,200 |
| 2014 | $440 | $22,000 | $4,100 | $17,900 |
| 2013 | $440 | $22,000 | $4,100 | $17,900 |
Source: Public Records
Map
Nearby Homes
- 0 E 18th St
- 1625 B St Unit 18
- 1625 B St Unit 26
- 1625 B St Unit 44
- 1639 E 18th St
- 1708 C St
- 1611 Johnson Ave
- 2007 Columbus Ave
- 1518 Martin Dr
- 1919 S Scatterfield Rd
- 2221 E Lynn St
- 815 E 19th St
- 2011 Mckinley St
- 811 E 21st St
- 807 E 21st St
- 1207 E 11th St
- 2116 George St
- 1830 Jefferson St
- 1817 Jefferson St
- 1806 Noble St
Your Personal Tour Guide
Ask me questions while you tour the home.