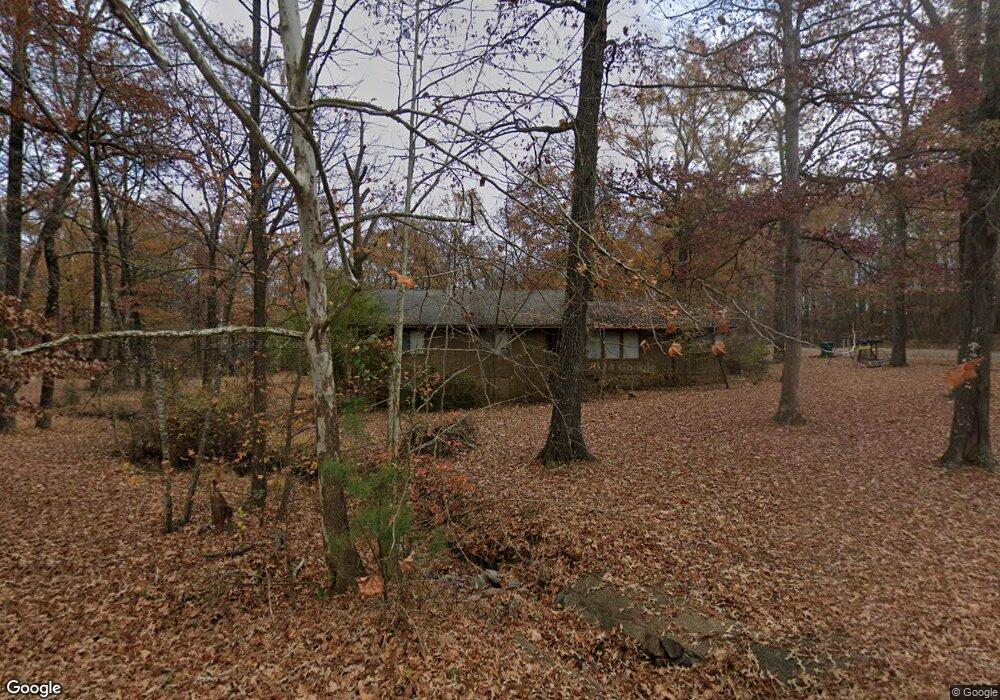
1509 Foxrun Rd Benton, AR 72019
Estimated Value: $201,547 - $261,000
Studio
--
Bath
2,028
Sq Ft
$110/Sq Ft
Est. Value
About This Home
This home is located at 1509 Foxrun Rd, Benton, AR 72019 and is currently estimated at $222,887, approximately $109 per square foot. 1509 Foxrun Rd is a home located in Saline County with nearby schools including Perrin Elementary School, Benton Middle School, and Benton Junior High School.
Ownership History
Date
Name
Owned For
Owner Type
Purchase Details
Closed on
Sep 1, 2010
Sold by
Secretary Of Hud
Bought by
Tyler Kenneth L
Current Estimated Value
Home Financials for this Owner
Home Financials are based on the most recent Mortgage that was taken out on this home.
Original Mortgage
$73,499
Outstanding Balance
$48,688
Interest Rate
4.58%
Mortgage Type
FHA
Estimated Equity
$174,199
Purchase Details
Closed on
Aug 24, 2009
Sold by
Citimortgage Inc
Bought by
The Secretary Of Hud
Purchase Details
Closed on
Aug 11, 2009
Sold by
Childers John Paul and Wilson Christine
Bought by
Citimortgage Inc
Purchase Details
Closed on
Mar 31, 2006
Sold by
Zearley Betty Jo and Zearley Herman Judson
Bought by
Childers John Paul
Home Financials for this Owner
Home Financials are based on the most recent Mortgage that was taken out on this home.
Original Mortgage
$116,176
Interest Rate
6.21%
Mortgage Type
FHA
Create a Home Valuation Report for This Property
The Home Valuation Report is an in-depth analysis detailing your home's value as well as a comparison with similar homes in the area
Home Values in the Area
Average Home Value in this Area
Purchase History
| Date | Buyer | Sale Price | Title Company |
|---|---|---|---|
| Tyler Kenneth L | -- | -- | |
| Tyler Kenneth L | -- | -- | |
| The Secretary Of Hud | -- | -- | |
| Citimortgage Inc | $133,981 | -- | |
| Childers John Paul | $118,000 | -- |
Source: Public Records
Mortgage History
| Date | Status | Borrower | Loan Amount |
|---|---|---|---|
| Open | Tyler Kenneth L | $73,499 | |
| Closed | Tyler Kenneth L | $73,499 | |
| Previous Owner | Childers John Paul | $116,176 |
Source: Public Records
Tax History
| Year | Tax Paid | Tax Assessment Tax Assessment Total Assessment is a certain percentage of the fair market value that is determined by local assessors to be the total taxable value of land and additions on the property. | Land | Improvement |
|---|---|---|---|---|
| 2025 | $1,843 | $35,721 | $6,160 | $29,561 |
| 2024 | $1,843 | $35,721 | $6,160 | $29,561 |
| 2023 | $1,805 | $35,721 | $6,160 | $29,561 |
| 2022 | $1,663 | $35,721 | $6,160 | $29,561 |
| 2021 | $1,521 | $27,540 | $4,400 | $23,140 |
| 2020 | $1,471 | $27,540 | $4,400 | $23,140 |
| 2019 | $1,471 | $27,540 | $4,400 | $23,140 |
| 2018 | $1,471 | $27,540 | $4,400 | $23,140 |
| 2017 | $1,449 | $27,540 | $4,400 | $23,140 |
| 2016 | $1,272 | $24,650 | $4,400 | $20,250 |
| 2015 | $1,322 | $24,650 | $4,400 | $20,250 |
| 2014 | $1,322 | $24,650 | $4,400 | $20,250 |
Source: Public Records
Map
Nearby Homes
- 20 Acres Congo Rd
- 1702 Glenda Ln
- 1449 Woolridge Dr
- 00 Congo Rd
- 1465 Woolridge
- 1120 Grand Teton Dr
- 1122 Grand Teton Dr
- 1104 Grand Teton Dr
- 3913 Sandra Ln
- 1115 Nature Way
- 913 Grand Teton Dr
- 909 Grand Teton Dr
- 1725 White Oak Ln
- 1804 Maple Ridge
- 2023 Longhills Rd E
- 1756 White Oak Ln
- 1612 Pinecroft St
- 816 Nature Way
- 451 Forest Pond Ln
- Lot 219 Cimarron Cove
Your Personal Tour Guide
Ask me questions while you tour the home.