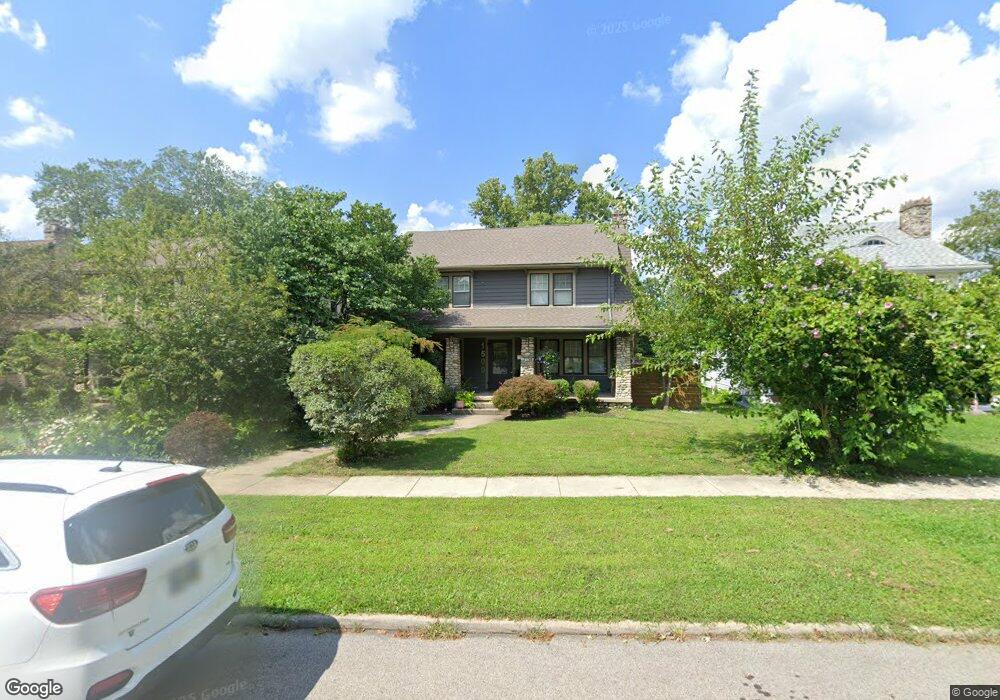
1509 Glenbeck Ave Dayton, OH 45409
Estimated Value: $270,000 - $307,342
3
Beds
2
Baths
2,066
Sq Ft
$137/Sq Ft
Est. Value
About This Home
This home is located at 1509 Glenbeck Ave, Dayton, OH 45409 and is currently estimated at $282,836, approximately $136 per square foot. 1509 Glenbeck Ave is a home located in Montgomery County with nearby schools including Southdale Elementary School, Van Buren Middle School, and Kettering Fairmont High School.
Ownership History
Date
Name
Owned For
Owner Type
Purchase Details
Closed on
Apr 27, 2018
Sold by
Fleck Robert E and Fleck Elizabeth J
Bought by
France Sean S
Current Estimated Value
Home Financials for this Owner
Home Financials are based on the most recent Mortgage that was taken out on this home.
Original Mortgage
$154,156
Outstanding Balance
$133,038
Interest Rate
4.5%
Mortgage Type
FHA
Estimated Equity
$149,798
Purchase Details
Closed on
Mar 31, 2010
Sold by
Robinson Scott F and Robinson Jennifer L
Bought by
Fleck Robert E and Fleck Elizabeth J
Home Financials for this Owner
Home Financials are based on the most recent Mortgage that was taken out on this home.
Original Mortgage
$137,362
Interest Rate
5.25%
Mortgage Type
FHA
Purchase Details
Closed on
Jul 25, 1997
Sold by
Hoffman Kenneth B and Hoffman Lisa A
Bought by
Robinson Scott F and Robinson Jennifer L
Create a Home Valuation Report for This Property
The Home Valuation Report is an in-depth analysis detailing your home's value as well as a comparison with similar homes in the area
Home Values in the Area
Average Home Value in this Area
Purchase History
| Date | Buyer | Sale Price | Title Company |
|---|---|---|---|
| France Sean S | $157,000 | Vantage Land Title | |
| Fleck Robert E | $150,000 | Attorney | |
| Robinson Scott F | $115,900 | Midwest Abstract Co |
Source: Public Records
Mortgage History
| Date | Status | Borrower | Loan Amount |
|---|---|---|---|
| Open | France Sean S | $154,156 | |
| Previous Owner | Fleck Robert E | $137,362 |
Source: Public Records
Tax History Compared to Growth
Tax History
| Year | Tax Paid | Tax Assessment Tax Assessment Total Assessment is a certain percentage of the fair market value that is determined by local assessors to be the total taxable value of land and additions on the property. | Land | Improvement |
|---|---|---|---|---|
| 2024 | $4,702 | $75,710 | $16,210 | $59,500 |
| 2023 | $4,702 | $75,710 | $16,210 | $59,500 |
| 2022 | $4,244 | $54,010 | $11,570 | $42,440 |
| 2021 | $3,926 | $54,010 | $11,570 | $42,440 |
| 2020 | $4,177 | $54,010 | $11,570 | $42,440 |
| 2019 | $4,503 | $51,760 | $11,030 | $40,730 |
| 2018 | $4,526 | $51,760 | $11,030 | $40,730 |
| 2017 | $4,188 | $51,760 | $11,030 | $40,730 |
| 2016 | $4,153 | $51,160 | $11,030 | $40,130 |
| 2015 | $4,052 | $51,160 | $11,030 | $40,130 |
| 2014 | $4,052 | $51,160 | $11,030 | $40,130 |
| 2012 | -- | $47,060 | $10,740 | $36,320 |
Source: Public Records
Map
Nearby Homes
- 1473 Constance Ave Unit 1481
- 1536 Old Lane Ave
- 1597 Old Lane Ave
- 2467 S Dixie Dr
- 1545 Cardington Rd
- 1420 Adirondack Trail
- 2230 S Patterson Blvd
- 1615 Carrollton Ave
- 1554 Crescent Blvd
- 1424 Elmdale Dr
- 1364 Elmdale Dr
- 1129 W Dorothy Ln
- 1211 Runnymede Rd
- 3060 Regent St
- 1160 Waving Willow Dr
- 3225 Southdale Dr Unit 1
- 447 Kramer Rd
- 1151 Brookview Ave
- 1314 Ridgeview Ave
- 1500 Ridgeway Rd
- 1517 Glenbeck Ave
- 1501 Glenbeck Ave
- 1525 Glenbeck Ave
- 1533 Glenbeck Ave
- 1445 Glenbeck Ave
- 2650 Crauder Ave
- 1508 Stockton Ave
- 1516 Stockton Ave
- 1541 Glenbeck Ave
- 1500 Stockton Ave
- 1524 Stockton Ave
- 1532 Stockton Ave
- 1437 Glenbeck Ave
- 1549 Glenbeck Ave
- 1496 Stockton Ave
- 1540 Stockton Ave
- 1460 Glenbeck Ave
- 1472 Glenbeck Ave
- 1524 Glenbeck Ave Unit 2
- 1524 Glenbeck Ave