Estimated Value: $166,000 - $188,000
3
Beds
3
Baths
1,429
Sq Ft
$124/Sq Ft
Est. Value
About This Home
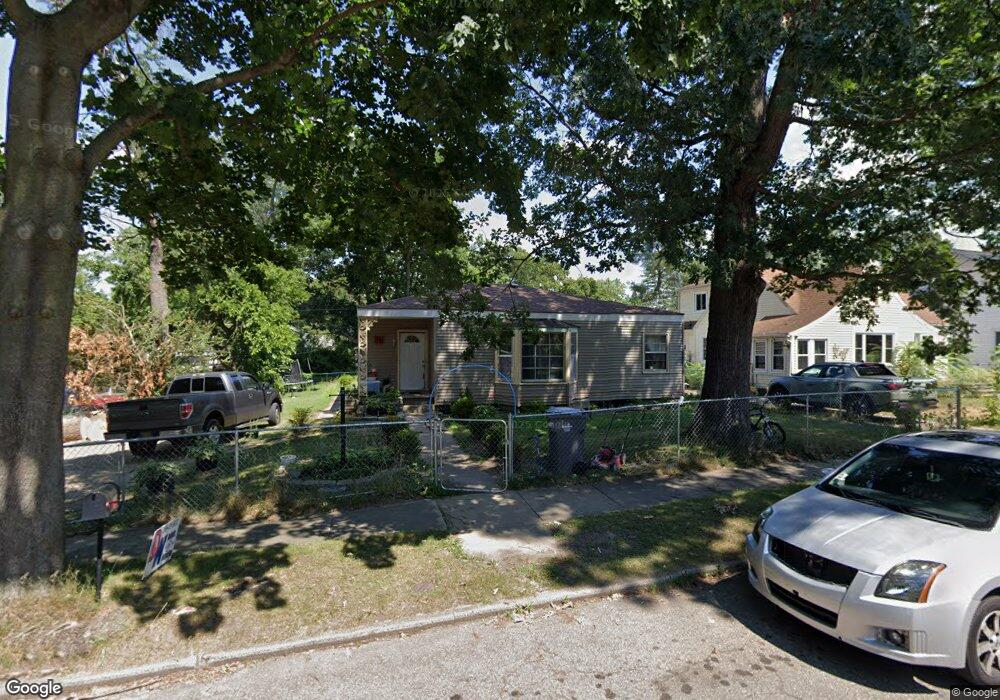
This home is located at 1509 Maple St, Niles, MI 49120 and is currently estimated at $177,327, approximately $124 per square foot. 1509 Maple St is a home located in Berrien County with nearby schools including James Ellis School, Howard-Ellis Elementary School, and Oak Manor Sixth Grade Center.
Ownership History
Date
Name
Owned For
Owner Type
Purchase Details
Closed on
Oct 18, 2010
Sold by
Eh Pooled 810 Lp
Bought by
Aguilar Alvaro and Carrillo Maria De La Luz
Current Estimated Value
Purchase Details
Closed on
Oct 8, 2010
Sold by
Deutsche Bank National Trust Company
Bought by
Eh Pooled 810 Lp
Purchase Details
Closed on
Mar 5, 2009
Sold by
Kowalski Richard E and Andrews Debra K
Bought by
Deutsche Bank National Trust Company
Purchase Details
Closed on
Mar 9, 1990
Purchase Details
Closed on
Jun 28, 1989
Purchase Details
Closed on
Sep 1, 1975
Create a Home Valuation Report for This Property
The Home Valuation Report is an in-depth analysis detailing your home's value as well as a comparison with similar homes in the area
Home Values in the Area
Average Home Value in this Area
Purchase History
| Date | Buyer | Sale Price | Title Company |
|---|---|---|---|
| Aguilar Alvaro | $17,000 | None Available | |
| Eh Pooled 810 Lp | $452 | None Available | |
| Deutsche Bank National Trust Company | $60,000 | None Available | |
| -- | -- | -- | |
| -- | -- | -- | |
| -- | $27,500 | -- |
Source: Public Records
Tax History Compared to Growth
Tax History
| Year | Tax Paid | Tax Assessment Tax Assessment Total Assessment is a certain percentage of the fair market value that is determined by local assessors to be the total taxable value of land and additions on the property. | Land | Improvement |
|---|---|---|---|---|
| 2025 | $1,579 | $79,500 | $0 | $0 |
| 2024 | $1,242 | $73,200 | $0 | $0 |
| 2023 | $1,191 | $63,900 | $0 | $0 |
| 2022 | $1,134 | $59,500 | $0 | $0 |
| 2021 | $1,390 | $55,500 | $4,700 | $50,800 |
| 2020 | $1,375 | $43,300 | $0 | $0 |
| 2019 | $1,358 | $50,700 | $12,800 | $37,900 |
| 2018 | $1,313 | $50,700 | $0 | $0 |
| 2017 | $1,291 | $43,300 | $0 | $0 |
| 2016 | $1,264 | $38,800 | $0 | $0 |
| 2015 | $1,260 | $35,700 | $0 | $0 |
| 2014 | $985 | $35,600 | $0 | $0 |
Source: Public Records
Map
Nearby Homes