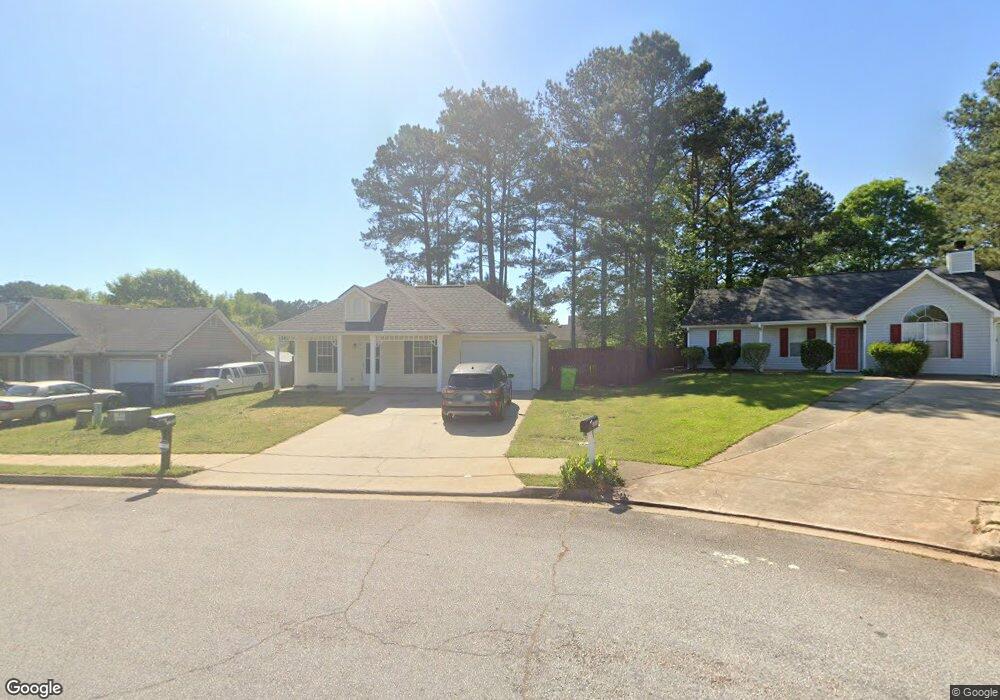
1509 N Hampton Ct Unit 1 Hampton, GA 30228
Estimated Value: $179,000 - $216,000
3
Beds
2
Baths
1,056
Sq Ft
$189/Sq Ft
Est. Value
About This Home
This home is located at 1509 N Hampton Ct Unit 1, Hampton, GA 30228 and is currently estimated at $200,081, approximately $189 per square foot. 1509 N Hampton Ct Unit 1 is a home located in Henry County with nearby schools including Hampton Elementary School, Hampton Middle School, and Hampton High School.
Ownership History
Date
Name
Owned For
Owner Type
Purchase Details
Closed on
Oct 18, 2022
Sold by
L & B Securities Llc
Bought by
Elite Property Options Llc
Current Estimated Value
Purchase Details
Closed on
Dec 15, 2012
Sold by
Baxter Thomas D
Bought by
L & B Securities Llc
Purchase Details
Closed on
Dec 1, 2010
Sold by
Kennedy Demond
Bought by
Baxter Thomas D
Purchase Details
Closed on
Dec 13, 2002
Sold by
Martin Lauren L
Bought by
Kennedy Demond
Home Financials for this Owner
Home Financials are based on the most recent Mortgage that was taken out on this home.
Original Mortgage
$92,856
Interest Rate
5.92%
Mortgage Type
FHA
Purchase Details
Closed on
Feb 5, 1998
Sold by
Bishop & Jackson Cons Co Inc
Bought by
Martin Lauren L
Home Financials for this Owner
Home Financials are based on the most recent Mortgage that was taken out on this home.
Original Mortgage
$81,186
Interest Rate
7.07%
Mortgage Type
FHA
Create a Home Valuation Report for This Property
The Home Valuation Report is an in-depth analysis detailing your home's value as well as a comparison with similar homes in the area
Home Values in the Area
Average Home Value in this Area
Purchase History
| Date | Buyer | Sale Price | Title Company |
|---|---|---|---|
| Elite Property Options Llc | -- | -- | |
| L & B Securities Llc | -- | -- | |
| Baxter Thomas D | $35,600 | -- | |
| Kennedy Demond | $94,400 | -- | |
| Martin Lauren L | $83,100 | -- |
Source: Public Records
Mortgage History
| Date | Status | Borrower | Loan Amount |
|---|---|---|---|
| Previous Owner | Kennedy Demond | $92,856 | |
| Previous Owner | Martin Lauren L | $81,186 |
Source: Public Records
Tax History
| Year | Tax Paid | Tax Assessment Tax Assessment Total Assessment is a certain percentage of the fair market value that is determined by local assessors to be the total taxable value of land and additions on the property. | Land | Improvement |
|---|---|---|---|---|
| 2025 | $3,227 | $80,200 | $12,000 | $68,200 |
| 2024 | $3,227 | $78,040 | $12,000 | $66,040 |
| 2023 | $2,797 | $71,440 | $10,000 | $61,440 |
| 2022 | $2,386 | $60,720 | $10,000 | $50,720 |
| 2021 | $1,725 | $49,920 | $10,000 | $39,920 |
| 2020 | $1,725 | $43,480 | $8,000 | $35,480 |
| 2019 | $1,207 | $40,000 | $8,000 | $32,000 |
| 2018 | $0 | $32,440 | $8,000 | $24,440 |
| 2016 | $1,207 | $30,000 | $6,000 | $24,000 |
| 2015 | $996 | $23,760 | $6,000 | $17,760 |
| 2014 | $816 | $18,960 | $4,000 | $14,960 |
Source: Public Records
Map
Nearby Homes
- 865 Steele Dr
- 670 Burtons Cove
- 1669 Graystone Dr
- 230 Norfolk Dr
- 140 Revolutionary Dr
- 116 Cabin Way
- 120 Cabin Way
- 160 Grafton St
- 112 Grafton St
- 205 Sullivan St
- 52 Pulaski Ave
- 417 Sawmill Trace
- 446 Sawmill Trace
- 169 Cabin Way
- 1209 N Hampton Dr
- 0 Cape Charles Ave Unit 10636645
- 00 Bear Creek Dr
- 683 Edgar
- 1921 Endress Cir
- 1816 Quaker St
- 1505 N Hampton Ct Unit 1
- 1513 N Hampton Ct
- 1397 N Hampton Dr
- 1401 N Hampton Dr
- 1517 N Hampton Ct
- 1393 N Hampton Dr
- 1393 N Hampton Dr Unit 1
- 1405 N Hampton Dr
- 1405 N Hampton Dr Unit 1
- 1520 N Hampton Ct
- 1389 N Hampton Dr
- 1389 N Hampton Dr Unit 1
- 1421 N Hampton Dr Unit 1
- 1500 N Hampton Ct
- 1506 N Hampton Ct Unit 1
- 1361 N Hampton Dr
- 1361 N Hampton Dr Unit 1
- 1357 N Hampton Dr Unit 1
- 1381 N Hampton Dr
- 1514 N Hampton Ct
Your Personal Tour Guide
Ask me questions while you tour the home.