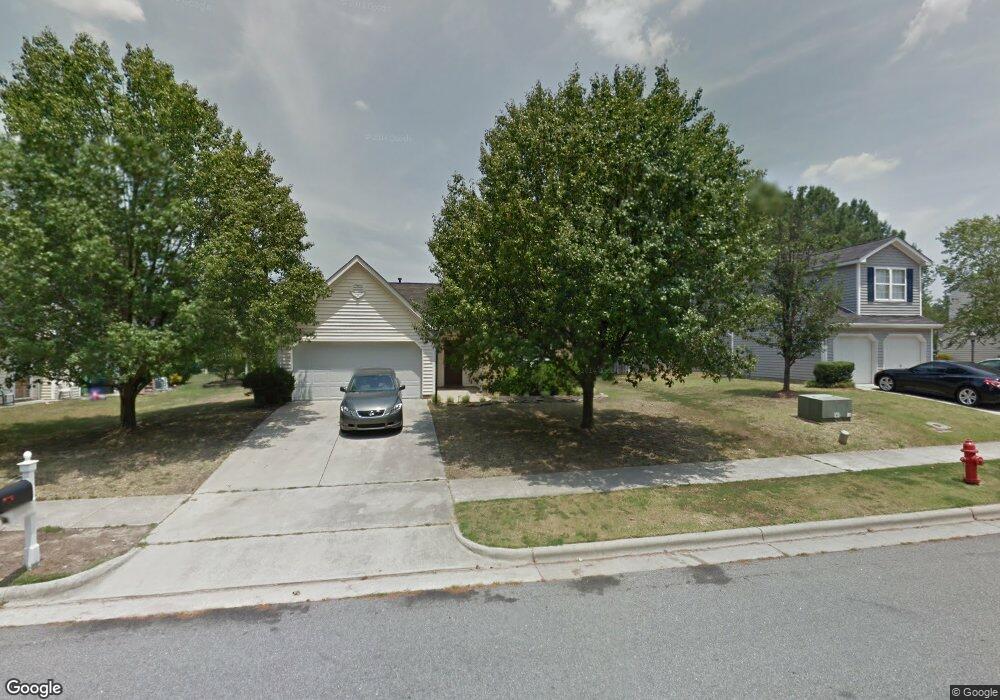
1509 Oak Grove Pkwy Durham, NC 27703
Eastern Durham NeighborhoodEstimated Value: $306,000 - $346,000
3
Beds
2
Baths
1,261
Sq Ft
$263/Sq Ft
Est. Value
About This Home
This home is located at 1509 Oak Grove Pkwy, Durham, NC 27703 and is currently estimated at $331,303, approximately $262 per square foot. 1509 Oak Grove Pkwy is a home located in Durham County with nearby schools including Oak Grove Elementary, John W Neal Middle School, and Southern School of Energy & Sustainability.
Ownership History
Date
Name
Owned For
Owner Type
Purchase Details
Closed on
Jun 26, 2009
Sold by
Burks Johnnie and Springfield Trimeta O
Bought by
Reaves Shenee
Current Estimated Value
Home Financials for this Owner
Home Financials are based on the most recent Mortgage that was taken out on this home.
Original Mortgage
$137,365
Outstanding Balance
$87,254
Interest Rate
4.79%
Mortgage Type
FHA
Estimated Equity
$244,049
Purchase Details
Closed on
Aug 26, 2008
Sold by
Burks Kimberly
Bought by
Burks Johnnie and Springfield Trimeta O
Home Financials for this Owner
Home Financials are based on the most recent Mortgage that was taken out on this home.
Original Mortgage
$123,271
Interest Rate
5.77%
Mortgage Type
FHA
Purchase Details
Closed on
Aug 27, 1999
Sold by
D R Horton Inc Torrey
Bought by
Burks Johnnie and Burks Kimberly
Home Financials for this Owner
Home Financials are based on the most recent Mortgage that was taken out on this home.
Original Mortgage
$121,838
Interest Rate
7.58%
Mortgage Type
FHA
Create a Home Valuation Report for This Property
The Home Valuation Report is an in-depth analysis detailing your home's value as well as a comparison with similar homes in the area
Home Values in the Area
Average Home Value in this Area
Purchase History
| Date | Buyer | Sale Price | Title Company |
|---|---|---|---|
| Reaves Shenee | $140,000 | None Available | |
| Burks Johnnie | -- | None Available | |
| Burks Johnnie | $123,500 | -- |
Source: Public Records
Mortgage History
| Date | Status | Borrower | Loan Amount |
|---|---|---|---|
| Open | Reaves Shenee | $137,365 | |
| Previous Owner | Burks Johnnie | $123,271 | |
| Previous Owner | Burks Johnnie | $121,838 |
Source: Public Records
Tax History Compared to Growth
Tax History
| Year | Tax Paid | Tax Assessment Tax Assessment Total Assessment is a certain percentage of the fair market value that is determined by local assessors to be the total taxable value of land and additions on the property. | Land | Improvement |
|---|---|---|---|---|
| 2025 | $3,060 | $308,676 | $87,750 | $220,926 |
| 2024 | $2,491 | $178,566 | $43,912 | $134,654 |
| 2023 | $2,339 | $178,566 | $43,912 | $134,654 |
| 2022 | $2,285 | $178,566 | $43,912 | $134,654 |
| 2021 | $2,275 | $178,566 | $43,912 | $134,654 |
| 2020 | $2,221 | $178,566 | $43,912 | $134,654 |
| 2019 | $2,221 | $178,566 | $43,912 | $134,654 |
| 2018 | $1,886 | $139,062 | $32,202 | $106,860 |
| 2017 | $1,872 | $139,062 | $32,202 | $106,860 |
| 2016 | $1,809 | $139,062 | $32,202 | $106,860 |
| 2015 | $1,888 | $136,396 | $27,900 | $108,496 |
| 2014 | $1,888 | $136,396 | $27,900 | $108,496 |
Source: Public Records
Map
Nearby Homes
- 210 Stallings Rd
- 2800-2809 Napoli Dr
- 1 Thorn Brook Ct
- 406 Robbins Rd
- 402 Robbins Rd
- 103 Bermuda Green Dr
- 4 Fire Rock Place
- 2010 Bunchberry Ln
- 106 Newberry Ln
- 208 Lick Creek Ln
- 1130 Arbor Edge Ln
- 5255 Wake Forest Rd
- 110 Kindlewood Dr
- 204 Hillview Dr
- 10 Autrey Mill Cir
- 5609 Thistlerock Ln
- 2117 Fletchers Ridge Dr
- 124 Green Gables Way
- 2 Red Sage Ct
- 1 Kings Grant Ct
- 1507 Oak Grove Pkwy
- 1601 Oak Grove Pkwy
- 110 Briarhaven Dr
- 108 Briarhaven Dr
- 114 Briarhaven Dr
- 1503 Oak Grove Pkwy
- 1503 Oak Grove Church Pkwy
- 1603 Oak Grove Pkwy
- 104 Briarhaven Dr
- 116 Briarhaven Dr
- 102 Briarhaven Dr
- 1607 Oak Grove Pkwy
- 1502 Oak Grove Church Pkwy
- 1502 Oak Grove Pkwy
- 107 Willowbrook Dr
- 109 Willowbrook Dr
- 103 Willowbrook Dr
- 109 Briarhaven Dr
- 111 Briarhaven Dr
- 101 Willowbrook Dr