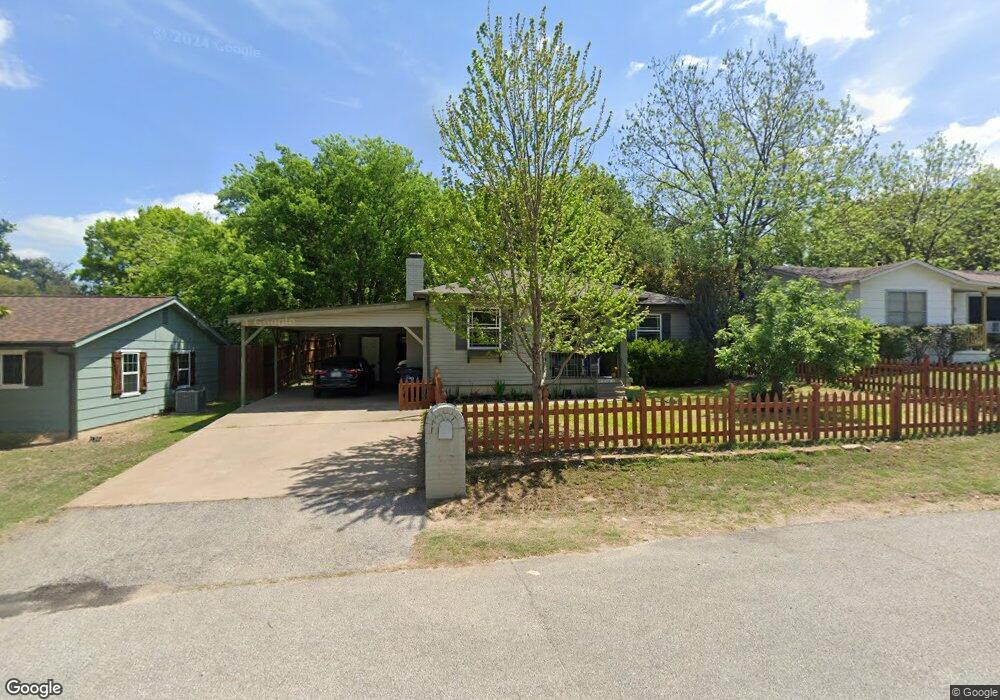
1509 S Elm St Weatherford, TX 76086
Estimated Value: $201,019 - $253,000
--
Bed
--
Bath
979
Sq Ft
$234/Sq Ft
Est. Value
About This Home
This home is located at 1509 S Elm St, Weatherford, TX 76086 and is currently estimated at $229,005, approximately $233 per square foot. 1509 S Elm St is a home located in Parker County with nearby schools including Austin Elementary School, Hall Middle School, and Weatherford High School.
Ownership History
Date
Name
Owned For
Owner Type
Purchase Details
Closed on
Feb 1, 2005
Sold by
Dunaway Deborah J
Bought by
Brown Robert Chay and Brown Stephanie J
Current Estimated Value
Home Financials for this Owner
Home Financials are based on the most recent Mortgage that was taken out on this home.
Original Mortgage
$62,372
Outstanding Balance
$29,536
Interest Rate
7.5%
Mortgage Type
Seller Take Back
Estimated Equity
$199,469
Purchase Details
Closed on
Nov 3, 2004
Sold by
Hightower Judith K
Bought by
Brown Robert C and Brown Stephanie
Purchase Details
Closed on
Dec 3, 1982
Bought by
Brown Robert C and Brown Stephanie
Create a Home Valuation Report for This Property
The Home Valuation Report is an in-depth analysis detailing your home's value as well as a comparison with similar homes in the area
Home Values in the Area
Average Home Value in this Area
Purchase History
| Date | Buyer | Sale Price | Title Company |
|---|---|---|---|
| Brown Robert Chay | $62,372 | None Available | |
| Brown Robert C | -- | -- | |
| Brown Robert C | -- | -- | |
| Brown Robert C | -- | -- |
Source: Public Records
Mortgage History
| Date | Status | Borrower | Loan Amount |
|---|---|---|---|
| Open | Brown Robert Chay | $62,372 |
Source: Public Records
Tax History Compared to Growth
Tax History
| Year | Tax Paid | Tax Assessment Tax Assessment Total Assessment is a certain percentage of the fair market value that is determined by local assessors to be the total taxable value of land and additions on the property. | Land | Improvement |
|---|---|---|---|---|
| 2025 | $1,446 | $141,643 | -- | -- |
| 2024 | $1,446 | $128,766 | -- | -- |
| 2023 | $1,446 | $117,060 | $0 | $0 |
| 2022 | $2,361 | $106,420 | $20,000 | $86,420 |
| 2021 | $2,342 | $106,420 | $20,000 | $86,420 |
| 2020 | $2,142 | $88,650 | $20,000 | $68,650 |
| 2019 | $2,212 | $88,650 | $20,000 | $68,650 |
| 2018 | $2,020 | $78,750 | $20,000 | $58,750 |
| 2017 | $2,072 | $78,750 | $20,000 | $58,750 |
| 2016 | $1,887 | $71,700 | $20,000 | $51,700 |
| 2015 | $1,478 | $71,700 | $20,000 | $51,700 |
| 2014 | $1,501 | $68,120 | $20,000 | $48,120 |
Source: Public Records
Map
Nearby Homes