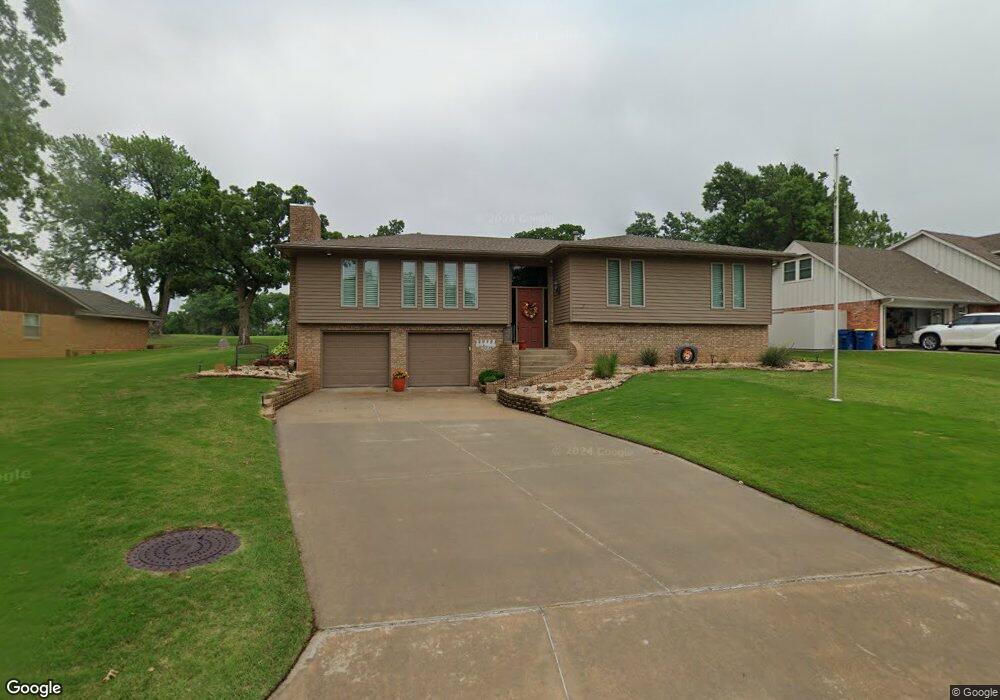
1509 S Fairway Dr Stillwater, OK 74074
Estimated Value: $358,442 - $440,000
3
Beds
3
Baths
3,300
Sq Ft
$122/Sq Ft
Est. Value
About This Home
This home is located at 1509 S Fairway Dr, Stillwater, OK 74074 and is currently estimated at $403,111, approximately $122 per square foot. 1509 S Fairway Dr is a home located in Payne County with nearby schools including Westwood Elementary School, Stillwater Middle School, and Stillwater Junior High School.
Ownership History
Date
Name
Owned For
Owner Type
Purchase Details
Closed on
Jul 16, 2024
Sold by
Huston Bobbe J
Bought by
Bobbe Huston Revocable Trust and Huston
Current Estimated Value
Purchase Details
Closed on
Mar 27, 2017
Sold by
Baker Steven R and Baker Deborah A
Bought by
Huston Scott L and Huston Bobbe J
Home Financials for this Owner
Home Financials are based on the most recent Mortgage that was taken out on this home.
Original Mortgage
$200,000
Interest Rate
4.16%
Mortgage Type
VA
Purchase Details
Closed on
Oct 14, 2016
Sold by
Ray Evans Little
Bought by
Bosler Aaron and Bosler Cara
Home Financials for this Owner
Home Financials are based on the most recent Mortgage that was taken out on this home.
Original Mortgage
$155,000
Interest Rate
3.47%
Create a Home Valuation Report for This Property
The Home Valuation Report is an in-depth analysis detailing your home's value as well as a comparison with similar homes in the area
Home Values in the Area
Average Home Value in this Area
Purchase History
| Date | Buyer | Sale Price | Title Company |
|---|---|---|---|
| Bobbe Huston Revocable Trust | -- | None Listed On Document | |
| Huston Scott L | $289,000 | None Available | |
| Bosler Aaron | -- | -- |
Source: Public Records
Mortgage History
| Date | Status | Borrower | Loan Amount |
|---|---|---|---|
| Previous Owner | Huston Scott L | $200,000 | |
| Previous Owner | Bosler Aaron | $155,000 | |
| Previous Owner | Bosler Aaron | -- |
Source: Public Records
Tax History Compared to Growth
Tax History
| Year | Tax Paid | Tax Assessment Tax Assessment Total Assessment is a certain percentage of the fair market value that is determined by local assessors to be the total taxable value of land and additions on the property. | Land | Improvement |
|---|---|---|---|---|
| 2025 | $3,934 | $39,849 | $7,508 | $32,341 |
| 2024 | $3,832 | $38,688 | $7,485 | $31,203 |
| 2023 | $3,832 | $37,561 | $6,175 | $31,386 |
| 2022 | $3,590 | $36,467 | $6,502 | $29,965 |
| 2021 | $3,413 | $35,405 | $6,840 | $28,565 |
| 2020 | $3,321 | $34,485 | $6,483 | $28,002 |
| 2019 | $3,291 | $33,481 | $4,560 | $28,921 |
| 2018 | $3,267 | $33,296 | $4,560 | $28,736 |
| 2017 | $2,358 | $24,337 | $4,560 | $19,777 |
| 2016 | $2,407 | $24,337 | $4,560 | $19,777 |
| 2015 | $2,441 | $24,337 | $4,560 | $19,777 |
| 2014 | $2,462 | $24,337 | $4,560 | $19,777 |
Source: Public Records
Map
Nearby Homes
- 5324 W Country Club Dr
- 1908 S Cowboy Ct
- 4725 W Country Club Dr
- 1011 Edgemoor Dr
- 1709 S Old Pond Dr
- 1109 Pecan Hill St
- 920 S Rock Hollow Ct
- 1101 Pecan Hill St
- 917 S Rock Hollow Ct
- 806 S Stoneybrook St
- 807 S Rock Hollow Ct
- 1304 Autry St
- 5715 W 8th Ct
- 1819 Hidden Oaks Dr
- 1601 Fiddlers Hill
- 1210 S Landry Ln
- 4224 Prescot Dr
- 1812 S Berkshire Dr
- 1605 S Dublin Dr
- 5708 Woodlake Dr
- 1505 S Fairway Dr
- 1513 S Fairway Dr
- 1501 S Fairway Dr
- 1517 S Fairway Dr
- 1514 S Fairway Dr
- 1510 S Fairway Dr
- 1518 S Fairway Dr
- 1506 S Fairway Dr
- 1423 S Fairway Dr
- 1520 S Fairway Dr
- 1502 S Fairway Dr
- 1524 S Fairway Dr
- 1523 S Fairway Dr
- 5215 W Country Club Dr
- 5215 W Country Club Dr
- 1309 S Westwood Ln
- 1310 S Westwood Ln
- 1222 S Fairway Dr
- 1223 S Fairway Dr
- 1301 S Westwood Ln