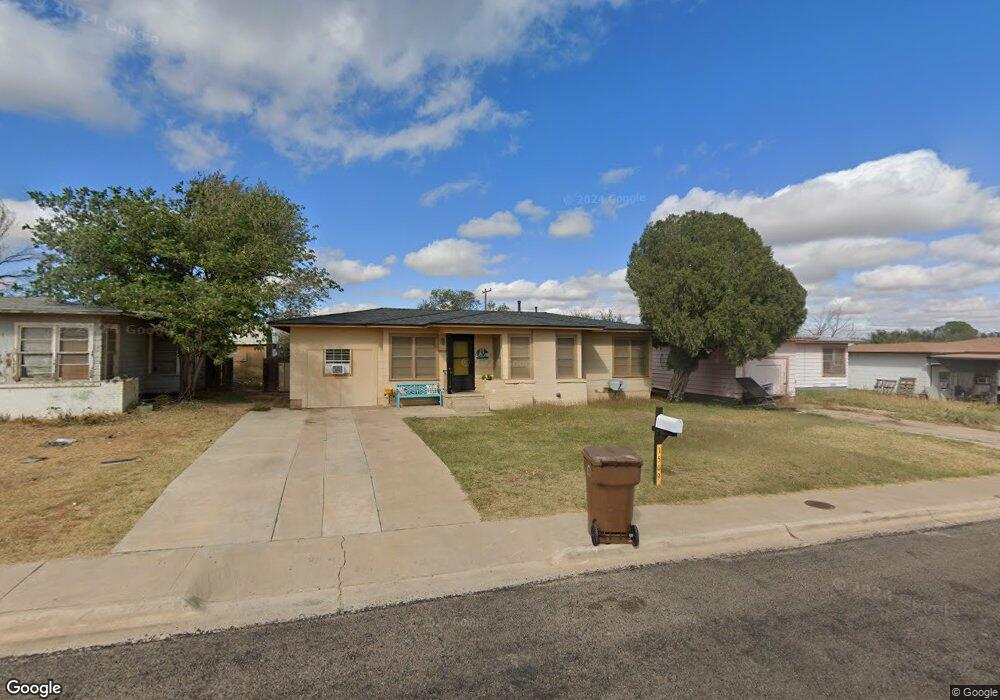
1509 Tucson Rd Big Spring, TX 79720
Estimated Value: $80,130 - $109,000
--
Bed
--
Bath
1,214
Sq Ft
$77/Sq Ft
Est. Value
About This Home
This home is located at 1509 Tucson Rd, Big Spring, TX 79720 and is currently estimated at $93,033, approximately $76 per square foot. 1509 Tucson Rd is a home located in Howard County with nearby schools including Big Spring High School.
Ownership History
Date
Name
Owned For
Owner Type
Purchase Details
Closed on
Nov 22, 2013
Sold by
Diaz Paul M and Diaz Jessica Bravo
Bought by
Bravo Jesus and Bravo Virginia
Current Estimated Value
Home Financials for this Owner
Home Financials are based on the most recent Mortgage that was taken out on this home.
Original Mortgage
$44,650
Outstanding Balance
$11,653
Interest Rate
4.29%
Mortgage Type
New Conventional
Estimated Equity
$81,380
Purchase Details
Closed on
Aug 30, 2007
Sold by
Fite James Lee
Bought by
Diaz Paul M
Home Financials for this Owner
Home Financials are based on the most recent Mortgage that was taken out on this home.
Original Mortgage
$35,068
Interest Rate
6.7%
Mortgage Type
FHA
Purchase Details
Closed on
Jul 20, 2006
Sold by
Fite Dorathy Ann and Fite Donald O
Bought by
Fite James Lee
Purchase Details
Closed on
Nov 22, 2004
Sold by
East Fourth Baptist Church
Bought by
Fite Dorathy Ann and Fite Donald O
Create a Home Valuation Report for This Property
The Home Valuation Report is an in-depth analysis detailing your home's value as well as a comparison with similar homes in the area
Home Values in the Area
Average Home Value in this Area
Purchase History
| Date | Buyer | Sale Price | Title Company |
|---|---|---|---|
| Bravo Jesus | -- | Surety Title Company | |
| Diaz Paul M | $35,068 | None Available | |
| Fite James Lee | -- | None Available | |
| Fite Dorathy Ann | -- | None Available |
Source: Public Records
Mortgage History
| Date | Status | Borrower | Loan Amount |
|---|---|---|---|
| Open | Bravo Jesus | $44,650 | |
| Previous Owner | Diaz Paul M | $35,068 |
Source: Public Records
Tax History Compared to Growth
Tax History
| Year | Tax Paid | Tax Assessment Tax Assessment Total Assessment is a certain percentage of the fair market value that is determined by local assessors to be the total taxable value of land and additions on the property. | Land | Improvement |
|---|---|---|---|---|
| 2024 | $1,127 | $63,323 | $3,933 | $59,390 |
| 2023 | $1,086 | $61,598 | $4,620 | $56,978 |
| 2022 | $1,209 | $59,207 | $4,200 | $55,007 |
| 2021 | $1,346 | $57,261 | $4,200 | $53,061 |
| 2020 | $1,189 | $50,025 | $4,200 | $45,825 |
| 2019 | $1,497 | $48,128 | $4,200 | $43,928 |
| 2018 | $1,466 | $48,942 | $4,200 | $44,742 |
| 2017 | $1,107 | $37,596 | $4,200 | $33,396 |
| 2016 | $1,132 | $38,452 | $4,200 | $34,252 |
| 2015 | -- | $36,992 | $4,200 | $32,792 |
| 2014 | -- | $33,491 | $2,400 | $31,091 |
Source: Public Records
Map
Nearby Homes
- 1410 Tucson Rd
- 1410 Sycamore St
- 1507 E 11th Place
- 1216 Ridgeroad Dr
- 706 Birdwell Ln
- 1313 Stadium Ave
- 1213 Ridgeroad Dr
- 205 Jefferson St
- 1706 Harvard Ave
- 202 Jefferson St
- 503 Washington Blvd
- 1200 Mulberry Ave
- 1722 Yale Ave
- 611 Ridgeroad Dr
- 304 Washington Blvd
- 100 Washington Blvd
- 1603 E 5th St
- 1201 Settles St
- 1200 Michael Ave
- 1314 Birdwell Ln
- 1511 Tucson Rd
- 1507 Tucson Rd
- 1513 Tucson Rd
- 1505 Tucson Rd
- 1508 Stadium Ave
- 1506 Stadium Ave
- 1510 Stadium Ave
- 1508 Tucson Rd
- 1515 Tucson Rd
- 1503 Tucson Rd
- 1512 Stadium Ave
- 1504 Stadium Ave
- 1510 Tucson Rd
- 1506 Tucson Rd
- 1512 Tucson Rd
- 1504 Tucson Rd
- 1502 Stadium Ave
- 1514 Stadium Ave
- 1517 Tucson Rd
- 1501 Tucson Rd