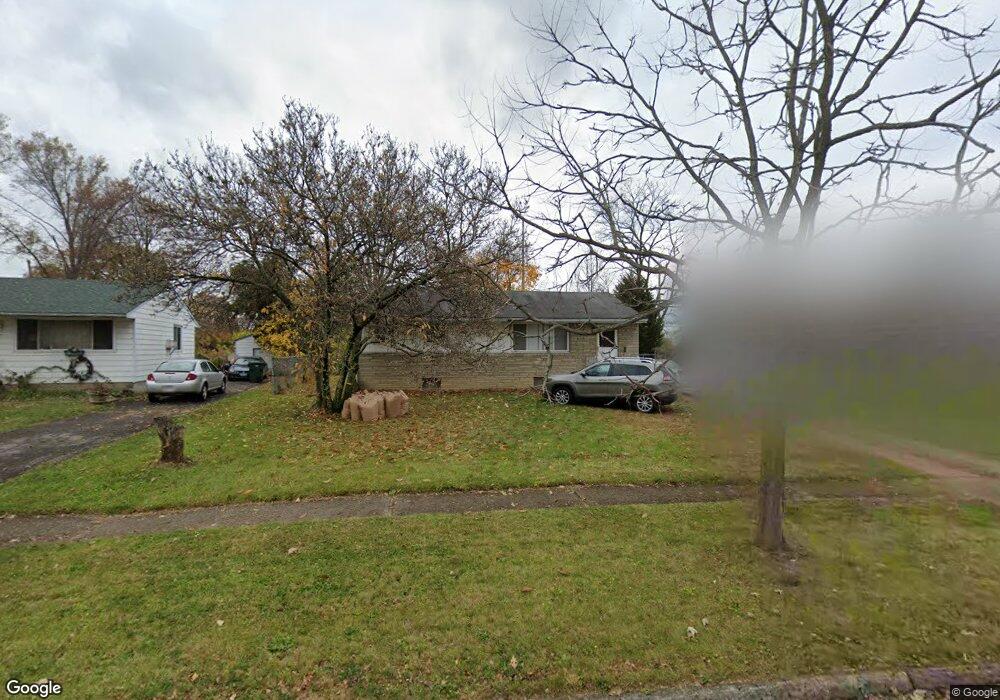
1509 Vilardo Ln Columbus, OH 43227
Leawood NeighborhoodEstimated Value: $151,000 - $186,083
3
Beds
2
Baths
1,112
Sq Ft
$157/Sq Ft
Est. Value
About This Home
This home is located at 1509 Vilardo Ln, Columbus, OH 43227 and is currently estimated at $175,021, approximately $157 per square foot. 1509 Vilardo Ln is a home located in Franklin County with nearby schools including Leawood Elementary School, Sherwood Middle School, and Walnut Ridge High School.
Ownership History
Date
Name
Owned For
Owner Type
Purchase Details
Closed on
Jul 25, 2003
Sold by
Hud
Bought by
Jordan Darren and Jordan Danielle L
Current Estimated Value
Home Financials for this Owner
Home Financials are based on the most recent Mortgage that was taken out on this home.
Original Mortgage
$66,900
Outstanding Balance
$28,892
Interest Rate
5.47%
Mortgage Type
Purchase Money Mortgage
Estimated Equity
$146,129
Purchase Details
Closed on
Feb 7, 2002
Sold by
Cason Mary
Bought by
Hud
Purchase Details
Closed on
Aug 17, 1998
Sold by
Heard Earlie
Bought by
Cason Mary
Purchase Details
Closed on
Feb 4, 1997
Sold by
Est Vaughn L Adams
Bought by
Heard Mary Cason and Heard Earlie
Home Financials for this Owner
Home Financials are based on the most recent Mortgage that was taken out on this home.
Original Mortgage
$69,939
Interest Rate
7.81%
Mortgage Type
New Conventional
Create a Home Valuation Report for This Property
The Home Valuation Report is an in-depth analysis detailing your home's value as well as a comparison with similar homes in the area
Home Values in the Area
Average Home Value in this Area
Purchase History
| Date | Buyer | Sale Price | Title Company |
|---|---|---|---|
| Jordan Darren | $70,000 | Professional Closing Title A | |
| Hud | $45,000 | Independent Title | |
| Cason Mary | -- | -- | |
| Heard Mary Cason | $70,000 | -- |
Source: Public Records
Mortgage History
| Date | Status | Borrower | Loan Amount |
|---|---|---|---|
| Open | Jordan Darren | $66,900 | |
| Previous Owner | Heard Mary Cason | $69,939 |
Source: Public Records
Tax History Compared to Growth
Tax History
| Year | Tax Paid | Tax Assessment Tax Assessment Total Assessment is a certain percentage of the fair market value that is determined by local assessors to be the total taxable value of land and additions on the property. | Land | Improvement |
|---|---|---|---|---|
| 2024 | $2,092 | $46,620 | $15,400 | $31,220 |
| 2023 | $2,066 | $46,620 | $15,400 | $31,220 |
| 2022 | $1,810 | $34,900 | $9,030 | $25,870 |
| 2021 | $1,813 | $34,900 | $9,030 | $25,870 |
| 2020 | $1,816 | $34,900 | $9,030 | $25,870 |
| 2019 | $1,686 | $27,800 | $7,250 | $20,550 |
| 2018 | $1,532 | $27,800 | $7,250 | $20,550 |
| 2017 | $1,685 | $27,800 | $7,250 | $20,550 |
| 2016 | $1,521 | $22,960 | $5,530 | $17,430 |
| 2015 | $1,381 | $22,960 | $5,530 | $17,430 |
| 2014 | $1,384 | $22,960 | $5,530 | $17,430 |
| 2013 | $803 | $27,020 | $6,510 | $20,510 |
Source: Public Records
Map
Nearby Homes
- 1656 Vilardo Ln
- 1640 Striebel Rd
- 1294 Dellwood Ave
- 1721 Bostwick Rd
- 1635 Elaine Rd
- 3861 Gilroy Rd
- 1252 Carolwood Ave
- 1490 Elaine Rd Unit 1462
- 1254 Elderwood Ave
- 1220 Elderwood Ave
- 3566 Seabrook Ave
- 4181 Colby Ave
- 3945 Dillon Dr
- 3955 E Fulton St
- 1291 Westphal Ave
- 4295 Colby Ave
- 1836 Penfield Ct S
- 931 E Fulton St
- 1543 S Hamilton Rd
- 3598 Astor Ave
- 1503 Vilardo Ln
- 1515 Vilardo Ln
- 1497 Vilardo Ln
- 1523 Vilardo Ln
- 1489 Vilardo Ln
- 1529 Vilardo Ln
- 1483 Vilardo Ln
- 1508 Vilardo Ln
- 1516 Vilardo Ln
- 1502 Vilardo Ln
- 1537 Vilardo Ln
- 1524 Vilardo Ln
- 1494 Vilardo Ln
- 1475 Vilardo Ln
- 3832 Kirkwood Rd
- 1488 Vilardo Ln
- 1532 Vilardo Ln
- 3826 Kirkwood Rd
- 1560 Bostwick Rd
- 1467 Vilardo Ln