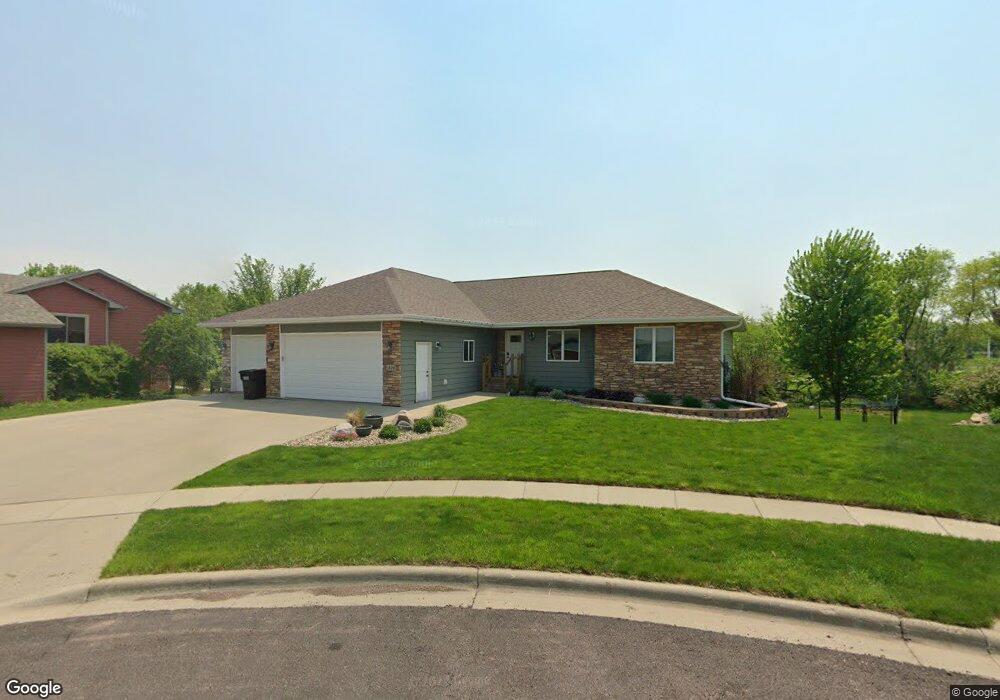
1509 W Creekside Cir Brandon, SD 57005
Estimated Value: $512,000 - $598,000
5
Beds
3
Baths
2,935
Sq Ft
$189/Sq Ft
Est. Value
About This Home
This home is located at 1509 W Creekside Cir, Brandon, SD 57005 and is currently estimated at $553,747, approximately $188 per square foot. 1509 W Creekside Cir is a home located in Minnehaha County with nearby schools including Robert Bennis Elementary School, Brandon Valley Middle School, and Brandon Valley Intermediate School.
Ownership History
Date
Name
Owned For
Owner Type
Purchase Details
Closed on
Sep 8, 2023
Sold by
Koob Joshua and Koob Kaylee
Bought by
Rients Brian T and Jahr Angela L
Current Estimated Value
Home Financials for this Owner
Home Financials are based on the most recent Mortgage that was taken out on this home.
Original Mortgage
$406,200
Outstanding Balance
$397,585
Interest Rate
6.96%
Estimated Equity
$156,162
Purchase Details
Closed on
Jul 27, 2018
Sold by
Deering Patrick G and Deering Jessica C
Bought by
Koob Joshua and Koob Kaylee
Home Financials for this Owner
Home Financials are based on the most recent Mortgage that was taken out on this home.
Original Mortgage
$326,800
Interest Rate
4.5%
Mortgage Type
New Conventional
Purchase Details
Closed on
Oct 25, 2011
Sold by
Kapperman Time and Tim Kapperman Construction
Bought by
Kapperman Tim
Create a Home Valuation Report for This Property
The Home Valuation Report is an in-depth analysis detailing your home's value as well as a comparison with similar homes in the area
Home Values in the Area
Average Home Value in this Area
Purchase History
| Date | Buyer | Sale Price | Title Company |
|---|---|---|---|
| Rients Brian T | $517,000 | -- | |
| Rients Brian T | $517,000 | -- | |
| Koob Joshua | $344,000 | Stewart Title Company | |
| Kapperman Tim | -- | -- | |
| Deering Patrick G | -- | -- |
Source: Public Records
Mortgage History
| Date | Status | Borrower | Loan Amount |
|---|---|---|---|
| Open | Rients Brian T | $406,200 | |
| Closed | Rients Brian T | $406,200 | |
| Previous Owner | Koob Joshua | $326,800 |
Source: Public Records
Tax History
| Year | Tax Paid | Tax Assessment Tax Assessment Total Assessment is a certain percentage of the fair market value that is determined by local assessors to be the total taxable value of land and additions on the property. | Land | Improvement |
|---|---|---|---|---|
| 2024 | $6,610 | $494,900 | $65,900 | $429,000 |
| 2023 | $6,825 | $485,700 | $56,700 | $429,000 |
| 2022 | $6,618 | $445,900 | $47,300 | $398,600 |
| 2021 | $5,839 | $370,200 | $0 | $0 |
| 2020 | $5,839 | $366,400 | $0 | $0 |
| 2019 | $5,486 | $336,707 | $0 | $0 |
| 2018 | $5,046 | $319,648 | $0 | $0 |
| 2017 | $5,053 | $307,361 | $37,058 | $270,303 |
| 2016 | $5,053 | $302,446 | $37,058 | $265,388 |
| 2015 | $5,144 | $295,195 | $37,057 | $258,138 |
| 2014 | -- | $280,328 | $37,057 | $243,271 |
Source: Public Records
Map
Nearby Homes
- 210 S Heritage Rd
- 305 S Heritage Rd
- 1625 Burton Dr
- 1505 W Legacy Dr
- 1313 Creekside Dr
- 1625 W River Bend St
- 1504 W Bennett Dr
- 2000 W Tyler Dr
- 1517 W Autumn Cir
- 1500 W Cir
- 200 Sunset Dr
- 900 Parkview Blvd
- 213 Spruce St
- 808 N Sioux Blvd
- 900 N Sioux Blvd
- 804 N Sioux Blvd
- 709 N Copper Ave
- 801 N Copper Ave
- 108 Thad St
- 404 N Sioux Blvd
- 1509 Creekside Cir
- 1505 Creekside Cir
- 1505 W Creekside Cir Cir
- 1513 W Creekside Cir
- 1517 Creekside Cir
- 1501 W Creekside Cir
- 1512 W Creekside Cir
- 1501 Creekside Cir
- 1501 W Creekside Cir Cir
- 1517 W Creekside Cir
- 1508 W Creekside Cir
- 1516 W Creekside Cir
- 1516 W Creekside Cir
- 1425 W Creekside Cir
- 1504 W Creekside Cir
- 1425 Creekside Cir
- 1500 W Creekside Cir
- 1421 Creekside Cir
- 1424 W Creekside Cir
- 214 S Heritage Rd
Your Personal Tour Guide
Ask me questions while you tour the home.