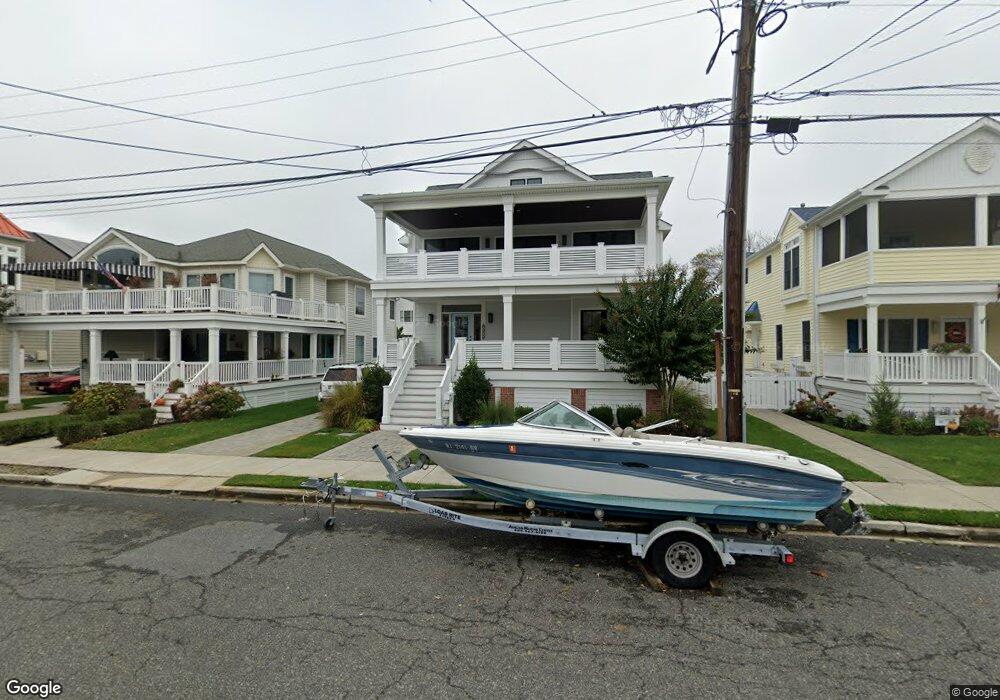
151 29th St Avalon, NJ 08202
Estimated Value: $3,248,000 - $4,049,000
Studio
--
Bath
3,379
Sq Ft
$1,083/Sq Ft
Est. Value
About This Home
This home is located at 151 29th St, Avalon, NJ 08202 and is currently estimated at $3,658,868, approximately $1,082 per square foot. 151 29th St is a home located in Cape May County with nearby schools including Avalon Elementary School.
Ownership History
Date
Name
Owned For
Owner Type
Purchase Details
Closed on
Mar 31, 2008
Sold by
Laratta Anthony R
Bought by
Egbert John T and Egbert Beverly S
Current Estimated Value
Home Financials for this Owner
Home Financials are based on the most recent Mortgage that was taken out on this home.
Original Mortgage
$415,000
Outstanding Balance
$249,301
Interest Rate
5%
Mortgage Type
Purchase Money Mortgage
Estimated Equity
$3,409,567
Create a Home Valuation Report for This Property
The Home Valuation Report is an in-depth analysis detailing your home's value as well as a comparison with similar homes in the area
Home Values in the Area
Average Home Value in this Area
Purchase History
| Date | Buyer | Sale Price | Title Company |
|---|---|---|---|
| Egbert John T | $951,000 | Commonwealth Land Title Insu |
Source: Public Records
Mortgage History
| Date | Status | Borrower | Loan Amount |
|---|---|---|---|
| Open | Egbert John T | $415,000 |
Source: Public Records
Tax History
| Year | Tax Paid | Tax Assessment Tax Assessment Total Assessment is a certain percentage of the fair market value that is determined by local assessors to be the total taxable value of land and additions on the property. | Land | Improvement |
|---|---|---|---|---|
| 2025 | $10,619 | $1,729,500 | $900,000 | $829,500 |
| 2024 | $10,619 | $1,729,500 | $900,000 | $829,500 |
| 2023 | $10,533 | $1,729,500 | $900,000 | $829,500 |
| 2022 | $9,824 | $1,729,500 | $900,000 | $829,500 |
| 2021 | $9,441 | $1,729,500 | $900,000 | $829,500 |
| 2020 | $9,097 | $1,729,500 | $900,000 | $829,500 |
| 2019 | $8,820 | $1,729,500 | $900,000 | $829,500 |
| 2018 | $8,440 | $1,729,500 | $900,000 | $829,500 |
| 2017 | $5,698 | $1,024,900 | $700,000 | $324,900 |
| 2016 | $5,637 | $1,024,900 | $700,000 | $324,900 |
| 2015 | $5,545 | $1,024,900 | $700,000 | $324,900 |
| 2014 | $5,483 | $1,024,900 | $700,000 | $324,900 |
Source: Public Records
Map
Nearby Homes
- 2968 First Ave
- 2988 1st Ave
- 179 27th St
- 2958 Avalon Ave
- 3149 First Ave
- 179 32nd St
- 55 32nd St W Unit C2B
- 55 32nd St W
- 55 32nd St W Unit 1A
- 158 32nd St
- 8 27th St Unit West
- 29 28th St E Unit 7
- 25 32nd St W
- 212 25th St Unit End Unit
- 173 33rd St Unit 3
- 2928 Ocean Dr Unit C-N
- 2934 Ocean Dr Unit North
- 162 33rd St
- 74 26th St E
- 161 24th St
Your Personal Tour Guide
Ask me questions while you tour the home.