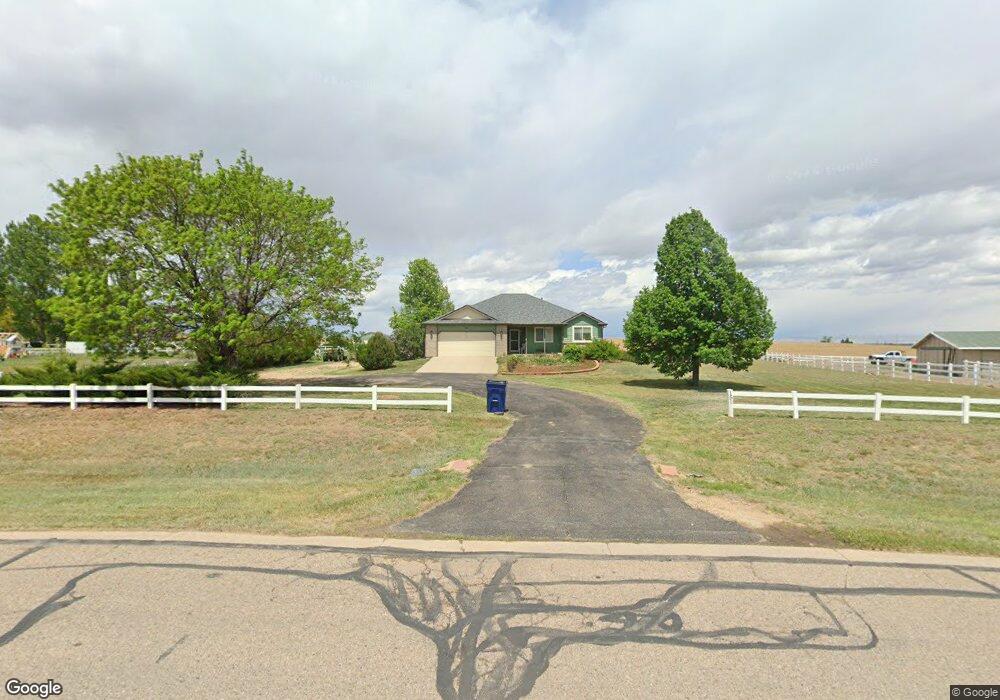
151 Bobcat Dr Milliken, CO 80543
Estimated Value: $650,919 - $803,000
3
Beds
2
Baths
1,493
Sq Ft
$497/Sq Ft
Est. Value
About This Home
This home is located at 151 Bobcat Dr, Milliken, CO 80543 and is currently estimated at $742,480, approximately $497 per square foot. 151 Bobcat Dr is a home located in Weld County with nearby schools including Milliken Elementary School, Milliken Middle School, and Roosevelt High School.
Ownership History
Date
Name
Owned For
Owner Type
Purchase Details
Closed on
Oct 16, 2007
Sold by
Baxter Nathan D
Bought by
Decino Anthony and Decino Judy
Current Estimated Value
Purchase Details
Closed on
May 19, 2000
Sold by
Ehrlich Ronald O
Bought by
Baxter Nathan D
Home Financials for this Owner
Home Financials are based on the most recent Mortgage that was taken out on this home.
Original Mortgage
$179,910
Interest Rate
8.14%
Purchase Details
Closed on
Jun 7, 1999
Sold by
Sunrise Development Llc
Bought by
Ehrlich Ronald O
Home Financials for this Owner
Home Financials are based on the most recent Mortgage that was taken out on this home.
Original Mortgage
$130,400
Interest Rate
6.92%
Purchase Details
Closed on
Jun 4, 1999
Sold by
Lot Holding Investments Llc
Bought by
Sunrise Development Llc
Home Financials for this Owner
Home Financials are based on the most recent Mortgage that was taken out on this home.
Original Mortgage
$130,400
Interest Rate
6.92%
Create a Home Valuation Report for This Property
The Home Valuation Report is an in-depth analysis detailing your home's value as well as a comparison with similar homes in the area
Home Values in the Area
Average Home Value in this Area
Purchase History
| Date | Buyer | Sale Price | Title Company |
|---|---|---|---|
| Decino Anthony | $245,000 | Utc | |
| Baxter Nathan D | $199,900 | -- | |
| Ehrlich Ronald O | $55,000 | -- | |
| Sunrise Development Llc | $22,810 | -- |
Source: Public Records
Mortgage History
| Date | Status | Borrower | Loan Amount |
|---|---|---|---|
| Previous Owner | Baxter Nathan D | $179,910 | |
| Previous Owner | Ehrlich Ronald O | $130,400 | |
| Closed | Ehrlich Ronald O | $15,000 |
Source: Public Records
Tax History
| Year | Tax Paid | Tax Assessment Tax Assessment Total Assessment is a certain percentage of the fair market value that is determined by local assessors to be the total taxable value of land and additions on the property. | Land | Improvement |
|---|---|---|---|---|
| 2025 | $2,872 | $42,310 | $10,310 | $32,000 |
| 2024 | $2,872 | $42,310 | $10,310 | $32,000 |
| 2023 | $2,933 | $39,690 | $10,920 | $28,770 |
| 2022 | $3,446 | $36,340 | $9,190 | $27,150 |
| 2021 | $3,721 | $37,380 | $9,450 | $27,930 |
| 2020 | $2,723 | $29,750 | $6,470 | $23,280 |
| 2019 | $2,140 | $29,750 | $6,470 | $23,280 |
| 2018 | $2,557 | $26,380 | $4,900 | $21,480 |
| 2017 | $2,559 | $26,380 | $4,900 | $21,480 |
| 2016 | $2,221 | $22,680 | $3,950 | $18,730 |
| 2015 | $2,257 | $22,680 | $3,950 | $18,730 |
| 2014 | $1,963 | $19,950 | $3,850 | $16,100 |
Source: Public Records
Map
Nearby Homes
- 941 S Rachel Ave
- 320 E Lilac St
- 1530 S Haymaker Dr
- 280 E Katsura St
- 9411 Meadow Farms Dr
- 831 S Rachel Ave
- 831 S Norma Ave
- 303 W Juneberry St
- 1303 S Harvester Dr
- 9360 Meadow Farms Dr
- 1384 S Growers Dr
- 1364 S Growers Dr
- 1576 S Frances Ave
- 221 E Holly St
- 1455 S Cattleman Dr
- 0 S Cora Ave
- 1305 S Cattleman Dr
- 123 S Marjorie Ave
- 1875 Rancher Dr
- 107 S Josephine Ave
Your Personal Tour Guide
Ask me questions while you tour the home.