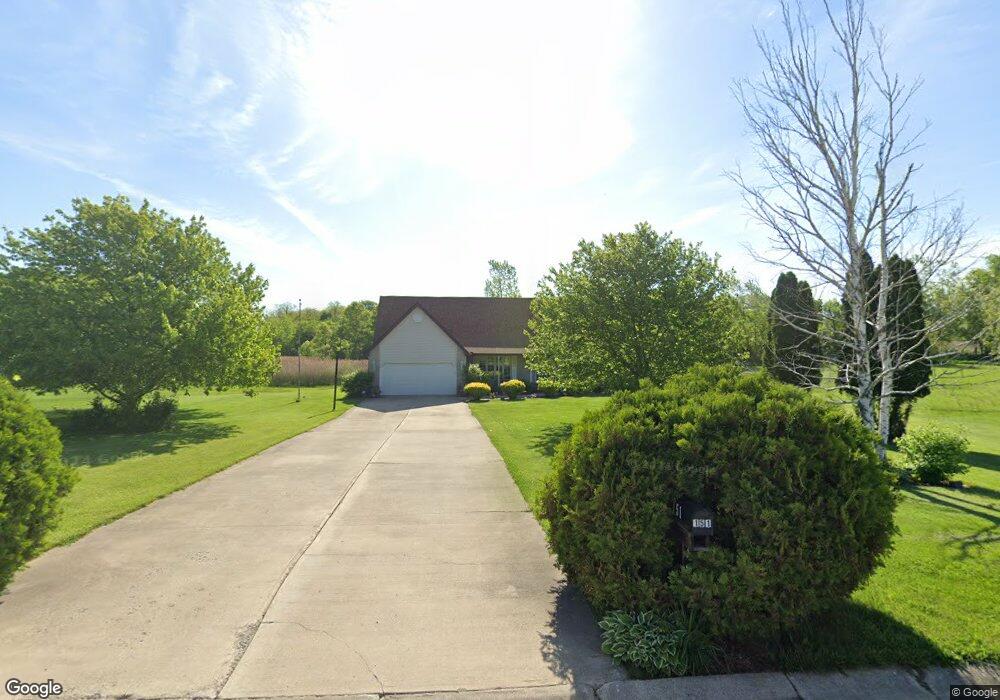
151 Decoy Dr Valparaiso, IN 46385
Porter County NeighborhoodEstimated Value: $389,527 - $444,000
3
Beds
3
Baths
1,820
Sq Ft
$230/Sq Ft
Est. Value
About This Home
This home is located at 151 Decoy Dr, Valparaiso, IN 46385 and is currently estimated at $418,132, approximately $229 per square foot. 151 Decoy Dr is a home located in Porter County with nearby schools including Liberty Elementary School, Liberty Intermediate School, and Chesterton Middle School.
Ownership History
Date
Name
Owned For
Owner Type
Purchase Details
Closed on
Mar 23, 2021
Sold by
Dicesare Jeffery E and Dicesare Kathleen Jane
Bought by
Dicesare Jeffery E and Dicesare Kathleen Jane
Current Estimated Value
Home Financials for this Owner
Home Financials are based on the most recent Mortgage that was taken out on this home.
Original Mortgage
$184,100
Outstanding Balance
$165,116
Interest Rate
2.73%
Mortgage Type
New Conventional
Estimated Equity
$253,016
Purchase Details
Closed on
Aug 22, 2008
Sold by
Dicesare Jeffery E
Bought by
Dicesare Jeffery E and Dicesare Kathleen Jane
Home Financials for this Owner
Home Financials are based on the most recent Mortgage that was taken out on this home.
Original Mortgage
$182,148
Interest Rate
6.31%
Mortgage Type
FHA
Create a Home Valuation Report for This Property
The Home Valuation Report is an in-depth analysis detailing your home's value as well as a comparison with similar homes in the area
Home Values in the Area
Average Home Value in this Area
Purchase History
| Date | Buyer | Sale Price | Title Company |
|---|---|---|---|
| Dicesare Jeffery E | -- | Meridian Title | |
| Dicesare Jeffery E | -- | Meridian Title Corp | |
| Dicesare Jeffery E | -- | Meridian Title Corp |
Source: Public Records
Mortgage History
| Date | Status | Borrower | Loan Amount |
|---|---|---|---|
| Open | Dicesare Jeffery E | $184,100 | |
| Previous Owner | Dicesare Jeffery E | $182,148 |
Source: Public Records
Tax History Compared to Growth
Tax History
| Year | Tax Paid | Tax Assessment Tax Assessment Total Assessment is a certain percentage of the fair market value that is determined by local assessors to be the total taxable value of land and additions on the property. | Land | Improvement |
|---|---|---|---|---|
| 2024 | $2,611 | $366,300 | $48,000 | $318,300 |
| 2023 | $2,292 | $324,600 | $41,700 | $282,900 |
| 2022 | $2,292 | $271,400 | $41,700 | $229,700 |
| 2021 | $1,997 | $251,200 | $41,700 | $209,500 |
| 2020 | $1,995 | $245,900 | $36,300 | $209,600 |
| 2019 | $2,048 | $241,900 | $36,300 | $205,600 |
| 2018 | $2,004 | $240,400 | $36,300 | $204,100 |
| 2017 | $1,804 | $226,100 | $36,300 | $189,800 |
| 2016 | $1,780 | $223,200 | $34,200 | $189,000 |
| 2014 | $1,642 | $211,700 | $32,000 | $179,700 |
| 2013 | -- | $206,000 | $32,700 | $173,300 |
Source: Public Records
Map
Nearby Homes