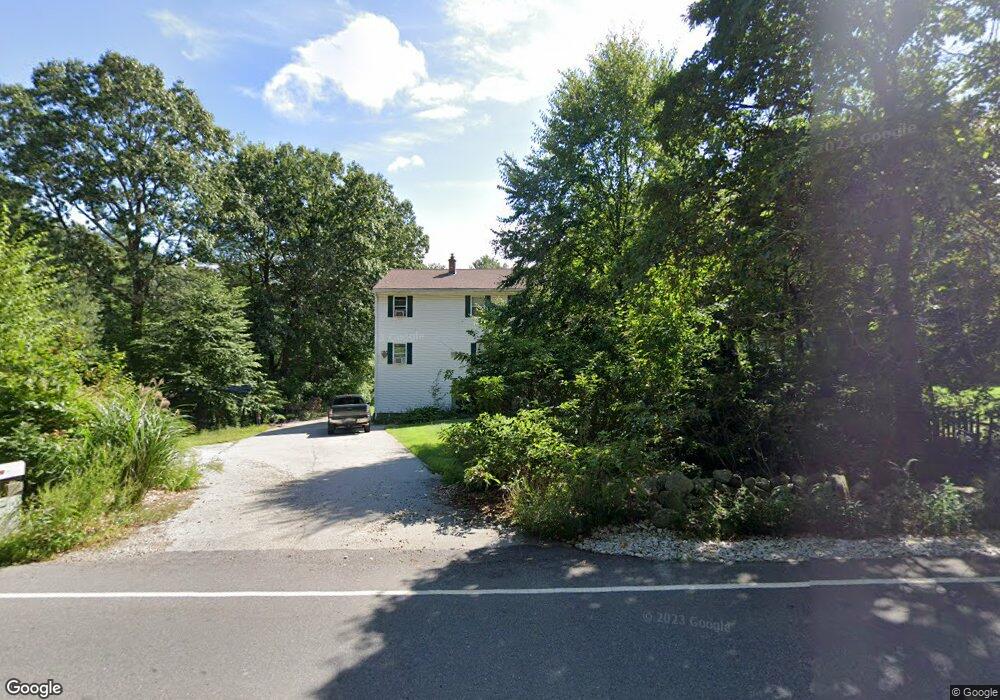
151 Dudley Rd Oxford, MA 01540
Estimated Value: $525,000 - $592,000
4
Beds
3
Baths
2,500
Sq Ft
$228/Sq Ft
Est. Value
About This Home
This home is located at 151 Dudley Rd, Oxford, MA 01540 and is currently estimated at $569,410, approximately $227 per square foot. 151 Dudley Rd is a home located in Worcester County with nearby schools including Alfred M Chaffee, Oxford High School, and Clara Barton Elementary School.
Ownership History
Date
Name
Owned For
Owner Type
Purchase Details
Closed on
Nov 24, 2004
Sold by
Goyette Candace L and Goyette James J
Bought by
Duquette Laureen and Duquette Richard G
Current Estimated Value
Home Financials for this Owner
Home Financials are based on the most recent Mortgage that was taken out on this home.
Original Mortgage
$265,200
Outstanding Balance
$132,989
Interest Rate
5.75%
Mortgage Type
Purchase Money Mortgage
Estimated Equity
$436,421
Purchase Details
Closed on
Feb 28, 2001
Sold by
Wells Kevin P and Wells Donna M
Bought by
Goyette James J and Goyette Candace L
Create a Home Valuation Report for This Property
The Home Valuation Report is an in-depth analysis detailing your home's value as well as a comparison with similar homes in the area
Home Values in the Area
Average Home Value in this Area
Purchase History
| Date | Buyer | Sale Price | Title Company |
|---|---|---|---|
| Duquette Laureen | $312,000 | -- | |
| Goyette James J | $169,900 | -- |
Source: Public Records
Mortgage History
| Date | Status | Borrower | Loan Amount |
|---|---|---|---|
| Open | Duquette Laureen | $265,200 | |
| Previous Owner | Goyette James J | $172,000 | |
| Previous Owner | Goyette James J | $30,000 |
Source: Public Records
Tax History
| Year | Tax Paid | Tax Assessment Tax Assessment Total Assessment is a certain percentage of the fair market value that is determined by local assessors to be the total taxable value of land and additions on the property. | Land | Improvement |
|---|---|---|---|---|
| 2025 | $61 | $484,400 | $104,400 | $380,000 |
| 2024 | $5,912 | $438,600 | $97,000 | $341,600 |
| 2023 | $5,841 | $428,200 | $86,600 | $341,600 |
| 2022 | $5,110 | $316,200 | $68,900 | $247,300 |
| 2021 | $4,976 | $301,000 | $65,500 | $235,500 |
| 2020 | $4,765 | $286,000 | $65,500 | $220,500 |
| 2019 | $4,412 | $259,100 | $65,600 | $193,500 |
| 2018 | $4,404 | $255,000 | $65,600 | $189,400 |
| 2017 | $4,420 | $262,300 | $65,600 | $196,700 |
| 2016 | $4,441 | $262,300 | $65,600 | $196,700 |
| 2015 | $4,142 | $262,300 | $65,600 | $196,700 |
| 2014 | $4,079 | $271,900 | $65,600 | $206,300 |
Source: Public Records
Map
Nearby Homes
- 43 Larned Rd
- 0 Old Southbridge Rd
- 5 Maid Marion St
- 13 Harwood St
- 20-22 Bacon St
- 113 Main St
- 2 Melissa Ln
- 13 Dolge Ct
- 58 Lelandville Rd
- 39 Fairlawn Ave
- 35 Pine Ridge Dr
- 4 Toria Heights Rd
- 17 Hugo Terrace
- 71 Charlton St
- 14 Walnut St
- 9 Howarth Rd
- 2 Potter Village Rd
- 29 Charlton St
- L0T 3 History Dr
- 3 Lelandville Rd
Your Personal Tour Guide
Ask me questions while you tour the home.