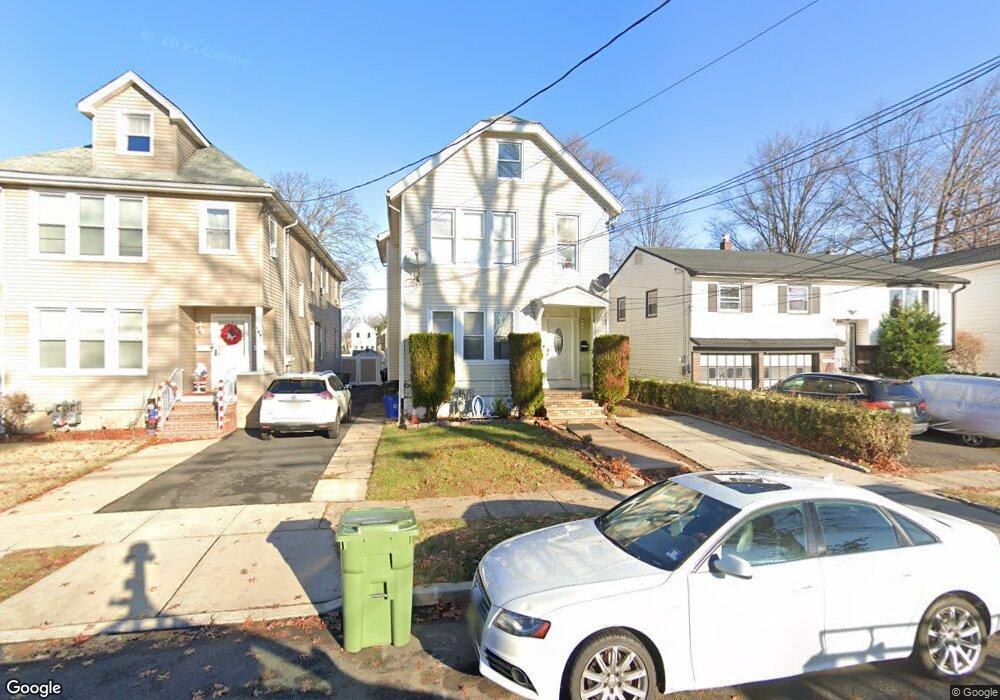
151 E 10th Ave Roselle, NJ 07203
Estimated Value: $518,000 - $637,000
Studio
--
Bath
2,486
Sq Ft
$230/Sq Ft
Est. Value
About This Home
This home is located at 151 E 10th Ave, Roselle, NJ 07203 and is currently estimated at $571,420, approximately $229 per square foot. 151 E 10th Ave is a home located in Union County with nearby schools including Dr Charles C Polk School, Leonard V. Moore Middle School, and Grace Wilday Junior High School.
Ownership History
Date
Name
Owned For
Owner Type
Purchase Details
Closed on
Aug 10, 2004
Sold by
Drummond Natalie
Bought by
Reyes Nubia
Current Estimated Value
Home Financials for this Owner
Home Financials are based on the most recent Mortgage that was taken out on this home.
Original Mortgage
$221,067
Outstanding Balance
$109,697
Interest Rate
6.01%
Mortgage Type
FHA
Estimated Equity
$461,723
Create a Home Valuation Report for This Property
The Home Valuation Report is an in-depth analysis detailing your home's value as well as a comparison with similar homes in the area
Home Values in the Area
Average Home Value in this Area
Purchase History
| Date | Buyer | Sale Price | Title Company |
|---|---|---|---|
| Reyes Nubia | $242,000 | -- |
Source: Public Records
Mortgage History
| Date | Status | Borrower | Loan Amount |
|---|---|---|---|
| Open | Reyes Nubia | $221,067 |
Source: Public Records
Tax History
| Year | Tax Paid | Tax Assessment Tax Assessment Total Assessment is a certain percentage of the fair market value that is determined by local assessors to be the total taxable value of land and additions on the property. | Land | Improvement |
|---|---|---|---|---|
| 2025 | $11,660 | $134,100 | $48,600 | $85,500 |
| 2024 | $11,368 | $134,100 | $48,600 | $85,500 |
| 2023 | $11,368 | $134,100 | $48,600 | $85,500 |
| 2022 | $11,447 | $134,100 | $48,600 | $85,500 |
| 2021 | $11,378 | $134,100 | $48,600 | $85,500 |
| 2020 | $11,342 | $134,100 | $48,600 | $85,500 |
| 2019 | $11,197 | $134,100 | $48,600 | $85,500 |
| 2018 | $11,136 | $134,100 | $48,600 | $85,500 |
| 2017 | $11,077 | $134,100 | $48,600 | $85,500 |
| 2016 | $10,833 | $134,100 | $48,600 | $85,500 |
| 2015 | $10,831 | $134,100 | $48,600 | $85,500 |
| 2014 | $10,530 | $134,100 | $48,600 | $85,500 |
Source: Public Records
Map
Nearby Homes
- 146 E 10th Ave Unit 2
- 211 E 10th Ave
- 208 E 8th Ave
- 902 Spruce St
- 226 E 8th Ave
- 238 E 8th Ave
- 247 E 7th Ave
- 142 Bonna Villa Ave
- 1022 Frank St
- 291 E 12th Ave
- 1129 Spruce St
- 215 Victory St
- 123 E 6th Ave
- 114 E 5th Ave
- 1202 Warren St
- 210 W 7th Ave
- 1025 Rivington St
- 208 Holly Dr
- 811 Jackson Ave
- 410 Morris Place
- 149 E 10th Ave
- 155 E 10th Ave
- 145 E 10th Ave
- 159 E 10th Ave
- 141 E 10th Ave
- 916 Walnut St Unit 1
- 916 Walnut St
- 163 E 10th Ave
- 163 E 10th Ave Unit 2
- 137 E 10th Ave
- 150 E 9th Ave
- 148 E 9th Ave
- 146 E 9th Ave
- 133 E 10th Ave
- 154 E 9th Ave
- 142 E 9th Ave
- 158 E 9th Ave
- 158 E 10th Ave
- 138 E 9th Ave
- 203 E 10th Ave
Your Personal Tour Guide
Ask me questions while you tour the home.