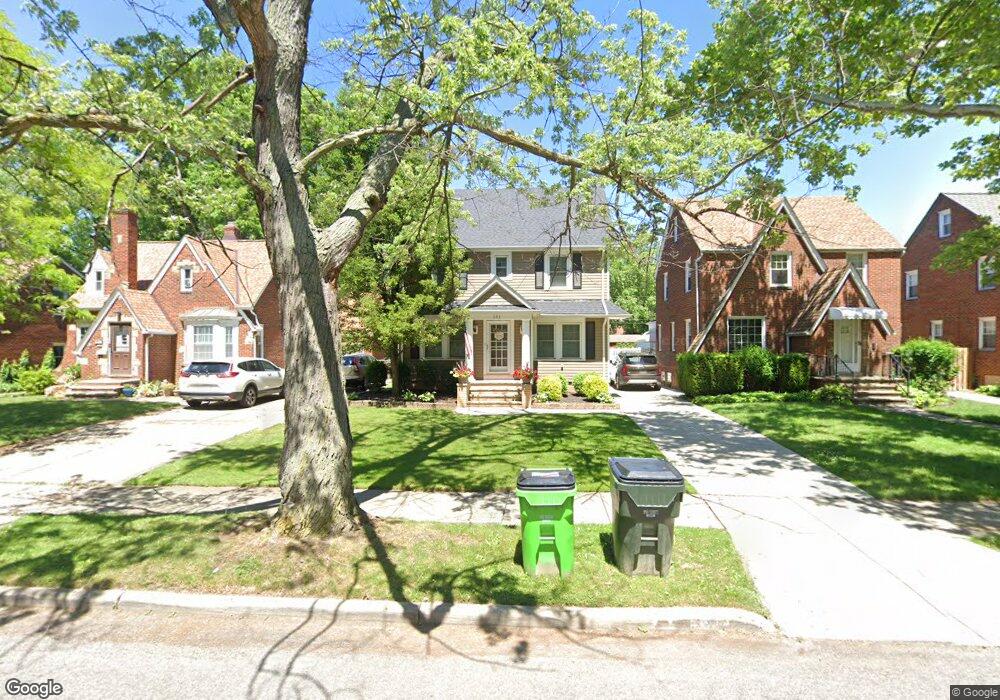
151 E 211th St Euclid, OH 44123
Estimated Value: $171,843 - $211,000
4
Beds
2
Baths
1,850
Sq Ft
$105/Sq Ft
Est. Value
About This Home
This home is located at 151 E 211th St, Euclid, OH 44123 and is currently estimated at $193,961, approximately $104 per square foot. 151 E 211th St is a home located in Cuyahoga County with nearby schools including Arbor Elementary School, Euclid Middle School, and Euclid High School.
Ownership History
Date
Name
Owned For
Owner Type
Purchase Details
Closed on
Sep 17, 2009
Sold by
Soric Dominic and Soric Catherine J
Bought by
Spada John and Heil Beth
Current Estimated Value
Home Financials for this Owner
Home Financials are based on the most recent Mortgage that was taken out on this home.
Original Mortgage
$92,300
Interest Rate
4.66%
Mortgage Type
New Conventional
Purchase Details
Closed on
Aug 19, 2003
Sold by
Santon Gregory
Bought by
Soric Dominic and Soric Catherine J
Home Financials for this Owner
Home Financials are based on the most recent Mortgage that was taken out on this home.
Original Mortgage
$126,022
Interest Rate
5.62%
Mortgage Type
FHA
Purchase Details
Closed on
Feb 5, 2002
Sold by
Estate Of Edward H Santon
Bought by
Santon Deanne M
Purchase Details
Closed on
Jan 1, 1975
Bought by
Santon Edward H and Santon Deanne M
Create a Home Valuation Report for This Property
The Home Valuation Report is an in-depth analysis detailing your home's value as well as a comparison with similar homes in the area
Home Values in the Area
Average Home Value in this Area
Purchase History
| Date | Buyer | Sale Price | Title Company |
|---|---|---|---|
| Spada John | $116,500 | Attorney | |
| Soric Dominic | $128,000 | Stewart Title | |
| Santon Deanne M | -- | -- | |
| Santon Edward H | -- | -- |
Source: Public Records
Mortgage History
| Date | Status | Borrower | Loan Amount |
|---|---|---|---|
| Closed | Spada John | $92,300 | |
| Previous Owner | Soric Dominic | $126,022 |
Source: Public Records
Tax History
| Year | Tax Paid | Tax Assessment Tax Assessment Total Assessment is a certain percentage of the fair market value that is determined by local assessors to be the total taxable value of land and additions on the property. | Land | Improvement |
|---|---|---|---|---|
| 2025 | $3,913 | $59,220 | $10,605 | $48,615 |
| 2024 | $4,042 | $59,220 | $10,605 | $48,615 |
| 2023 | $3,666 | $42,810 | $8,790 | $34,020 |
| 2022 | $3,582 | $42,805 | $8,785 | $34,020 |
| 2021 | $3,998 | $42,810 | $8,790 | $34,020 |
| 2020 | $4,054 | $39,620 | $8,120 | $31,500 |
| 2019 | $3,649 | $113,200 | $23,200 | $90,000 |
| 2018 | $3,624 | $39,620 | $8,120 | $31,500 |
| 2017 | $3,867 | $34,720 | $6,930 | $27,790 |
| 2016 | $3,876 | $34,720 | $6,930 | $27,790 |
| 2015 | $3,524 | $34,720 | $6,930 | $27,790 |
| 2014 | $3,524 | $34,720 | $6,930 | $27,790 |
Source: Public Records
Map
Nearby Homes
- 144 E 208th St
- 226 E 216th St
- 285 E 216th St
- 94 E 217th St
- 324 E 215th St
- 273 E 208th St
- 336 E 222nd St
- 170 E 220th St
- 21051 S Lake Shore Blvd
- 71 E 201st St
- 291 E 204th St
- 421 Kenwood Dr Unit G
- 174 E 200th St
- 20330 S Lake Shore Blvd
- 21000 Crystal Ave
- 20700 Crystal Ave
- 422 Clearview Dr Unit J10
- 461 Kenwood Dr Unit T3
- 20931 Priday Ave
- 450 Kenwood Dr Unit D-12
Your Personal Tour Guide
Ask me questions while you tour the home.