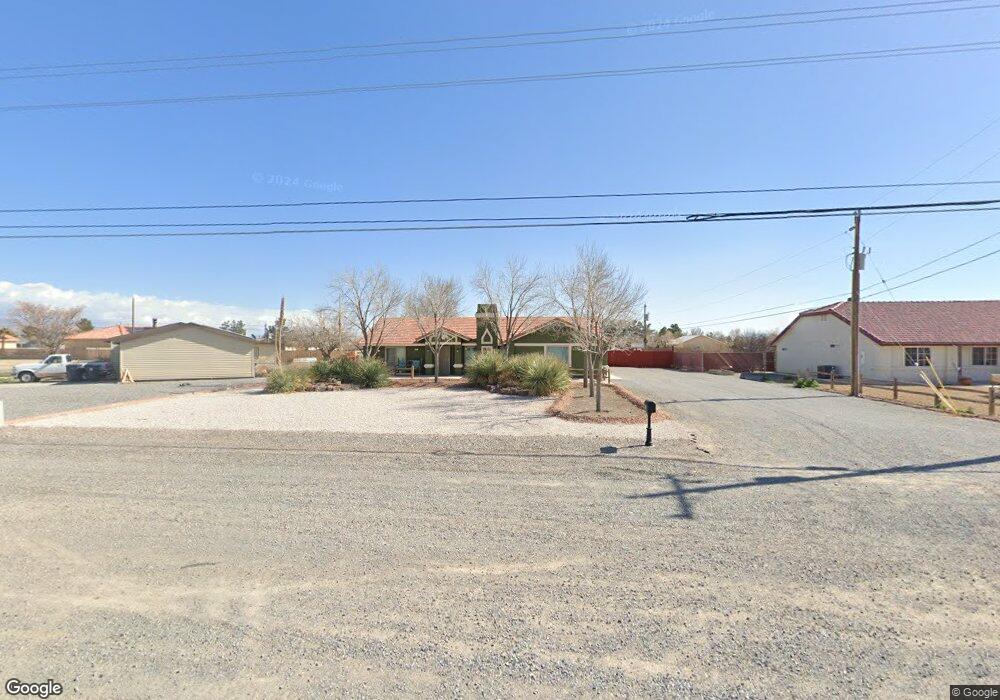
151 E Calvada Blvd Pahrump, NV 89048
Estimated Value: $283,000 - $402,000
Studio
--
Bath
1,363
Sq Ft
$248/Sq Ft
Est. Value
About This Home
This home is located at 151 E Calvada Blvd, Pahrump, NV 89048 and is currently estimated at $338,464, approximately $248 per square foot. 151 E Calvada Blvd is a home located in Nye County with nearby schools including Floyd Elementary School, Rosemary Clarke Middle School, and Pahrump Valley High School.
Ownership History
Date
Name
Owned For
Owner Type
Purchase Details
Closed on
Dec 3, 2024
Sold by
Torrence Terri
Bought by
Terri Torrence Revocable Living Trust and Torrence
Current Estimated Value
Purchase Details
Closed on
Nov 20, 2006
Sold by
Aldana Arnold J
Bought by
Aldana Rachel
Purchase Details
Closed on
Aug 8, 2006
Sold by
Torrence Terri
Bought by
Torrence Terri and Aldana Rachel
Purchase Details
Closed on
Feb 14, 2005
Sold by
Aorrence Terri A
Bought by
Norton Rebeah A and Norton Terri A
Purchase Details
Closed on
Oct 1, 2003
Sold by
Aldana Rachel
Bought by
Torrence Terri A
Home Financials for this Owner
Home Financials are based on the most recent Mortgage that was taken out on this home.
Original Mortgage
$188,500
Interest Rate
6.36%
Mortgage Type
New Conventional
Create a Home Valuation Report for This Property
The Home Valuation Report is an in-depth analysis detailing your home's value as well as a comparison with similar homes in the area
Purchase History
| Date | Buyer | Sale Price | Title Company |
|---|---|---|---|
| Terri Torrence Revocable Living Trust | -- | None Listed On Document | |
| Aldana Rachel | -- | Chicago Title | |
| Torrence Terri | -- | None Available | |
| Norton Rebeah A | -- | None Available | |
| Torrence Terri A | -- | Chicago Title |
Source: Public Records
Mortgage History
| Date | Status | Borrower | Loan Amount |
|---|---|---|---|
| Previous Owner | Torrence Terri A | $188,500 |
Source: Public Records
Tax History
| Year | Tax Paid | Tax Assessment Tax Assessment Total Assessment is a certain percentage of the fair market value that is determined by local assessors to be the total taxable value of land and additions on the property. | Land | Improvement |
|---|---|---|---|---|
| 2025 | $1,240 | $54,753 | $2,894 | $51,859 |
| 2024 | $1,240 | $54,465 | $2,894 | $51,571 |
| 2023 | $1,240 | $51,212 | $2,894 | $48,318 |
| 2022 | $1,168 | $46,807 | $2,894 | $43,913 |
| 2021 | $1,137 | $45,145 | $2,315 | $42,830 |
| 2020 | $1,105 | $45,302 | $2,315 | $42,987 |
| 2019 | $1,072 | $53,349 | $2,315 | $51,034 |
| 2018 | $1,042 | $51,196 | $1,852 | $49,344 |
| 2017 | $1,013 | $41,142 | $1,852 | $39,290 |
| 2016 | $988 | $29,175 | $1,852 | $27,323 |
| 2015 | $978 | $27,028 | $1,852 | $25,176 |
| 2014 | $951 | $29,188 | $1,852 | $27,336 |
Source: Public Records
Map
Nearby Homes
- 2201 Valentine Ave
- 2181 Arrow Ct
- 61 E Calvada Blvd
- 31 Saules St
- 2380 Xenia Ave
- 321 Bronco St
- 1891 Waterhole Canyon Ave
- 240 Chevron St
- 440 Arapahoe St
- 140 Domingo St
- 2231 S Blagg Rd
- 1791 Jerome Ln
- 481 E Arapahoe St
- 420 Belville Rd
- 440 E Bellville Rd
- 1770 Jerome Ln
- 440 Chevron St
- 1760 Ironside St
- 2811 S Manzanita Dr
- 2781 S Manzanita Dr
- 141 E Calvada Blvd
- 161 E Calvada Blvd
- 2160 Valentine Ave
- 131 E Calvada Blvd
- 2211 Wagon Ave
- 2170 Valentine Ave
- 181 E Calvada Blvd Unit 43
- 181 E Calvada Blvd
- 2161 Valentine Ave
- 121 E Calvada Blvd
- 201 E Calvada Blvd
- 2171 Valentine Ave
- 2210 Wagon Ave
- 2190 Valentine Ave
- 111 E Calvada Blvd
- 2181 Valentine Ave
- 2261 Wagon Ave
- 2230 Wagon Ave
- 2240 Wagon Ave
- 2191 Valentine Ave Unit 4B
Your Personal Tour Guide
Ask me questions while you tour the home.