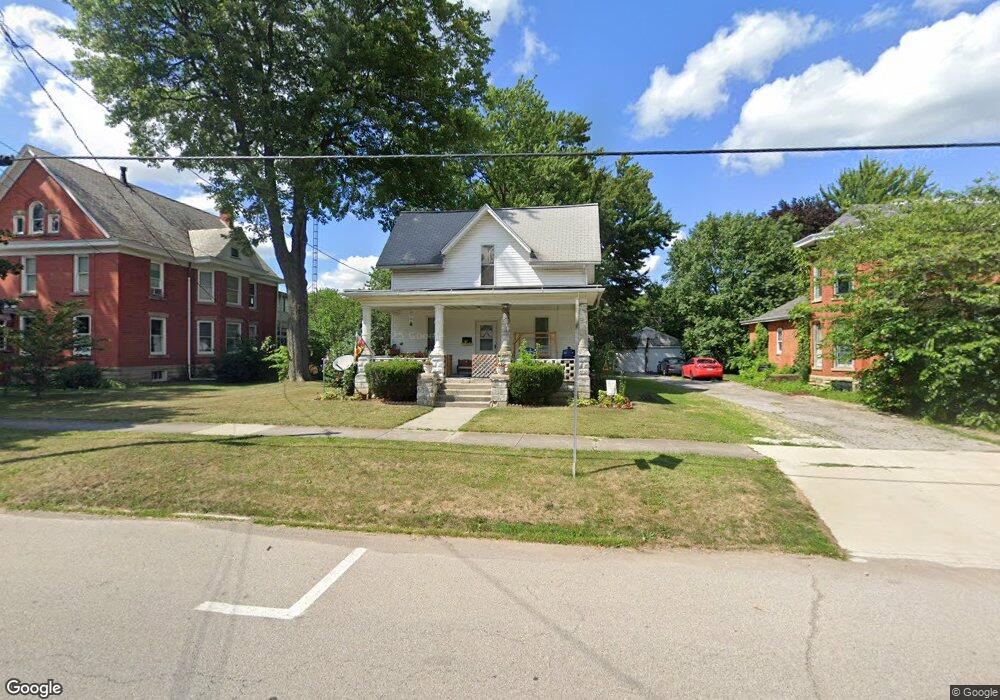
151 E Main St New London, OH 44851
Estimated Value: $120,000 - $176,000
3
Beds
1
Bath
1,672
Sq Ft
$84/Sq Ft
Est. Value
About This Home
This home is located at 151 E Main St, New London, OH 44851 and is currently estimated at $139,643, approximately $83 per square foot. 151 E Main St is a home located in Huron County with nearby schools including New London Elementary School, New London Middle School, and New London High School.
Ownership History
Date
Name
Owned For
Owner Type
Purchase Details
Closed on
Aug 13, 2010
Bought by
Patricia L Dvorak
Current Estimated Value
Purchase Details
Closed on
Jun 22, 2010
Bought by
Secretary Of Housing And Urban Developme
Purchase Details
Closed on
May 24, 2010
Bought by
Chase Home Finance Llc
Purchase Details
Closed on
Apr 15, 2003
Bought by
Frost Colleen S and Aberham Langdon O
Purchase Details
Closed on
Jan 17, 2003
Bought by
Forbush Dean R
Purchase Details
Closed on
Oct 2, 2002
Bought by
Secretary Of Housing And
Purchase Details
Closed on
Aug 30, 1999
Sold by
Stocking Dorothy
Bought by
Ryan Jerahme L and Ryan Shelley A
Home Financials for this Owner
Home Financials are based on the most recent Mortgage that was taken out on this home.
Original Mortgage
$54,839
Interest Rate
7.61%
Mortgage Type
FHA
Purchase Details
Closed on
Aug 28, 1967
Bought by
Stocking Dorothy B
Create a Home Valuation Report for This Property
The Home Valuation Report is an in-depth analysis detailing your home's value as well as a comparison with similar homes in the area
Home Values in the Area
Average Home Value in this Area
Purchase History
| Date | Buyer | Sale Price | Title Company |
|---|---|---|---|
| Patricia L Dvorak | -- | -- | |
| Secretary Of Housing And Urban Developme | -- | -- | |
| Chase Home Finance Llc | $50,000 | -- | |
| Frost Colleen S | $95,700 | -- | |
| Forbush Dean R | -- | -- | |
| Secretary Of Housing And | -- | -- | |
| Ryan Jerahme L | $55,000 | -- | |
| Stocking Dorothy B | -- | -- |
Source: Public Records
Mortgage History
| Date | Status | Borrower | Loan Amount |
|---|---|---|---|
| Previous Owner | Ryan Jerahme L | $54,839 |
Source: Public Records
Tax History Compared to Growth
Tax History
| Year | Tax Paid | Tax Assessment Tax Assessment Total Assessment is a certain percentage of the fair market value that is determined by local assessors to be the total taxable value of land and additions on the property. | Land | Improvement |
|---|---|---|---|---|
| 2024 | $1,203 | $33,130 | $4,900 | $28,230 |
| 2023 | $1,203 | $25,010 | $4,040 | $20,970 |
| 2022 | $876 | $25,010 | $4,040 | $20,970 |
| 2021 | $876 | $25,010 | $4,040 | $20,970 |
| 2020 | $822 | $21,890 | $4,040 | $17,850 |
| 2019 | $818 | $21,890 | $4,040 | $17,850 |
| 2018 | $799 | $21,890 | $4,040 | $17,850 |
| 2017 | $692 | $20,460 | $4,040 | $16,420 |
| 2016 | $680 | $20,460 | $4,040 | $16,420 |
| 2015 | $673 | $20,270 | $4,050 | $16,220 |
| 2014 | $642 | $18,970 | $4,060 | $14,910 |
| 2013 | $637 | $18,970 | $4,060 | $14,910 |
Source: Public Records
Map
Nearby Homes
- 155 E Main St
- 201 E Main St
- 113 3rd St
- 34 Park Ave
- 41 N Railroad St
- 99 S Main St
- 0 Section Line Rd Unit 20253852
- 128 1st St
- 109 Clifton St
- 21 Cedar St
- 115 W Main St
- 152 N Main St Unit 2
- 1345 County Road 16
- 37 State Route 60
- 141 State Route 60
- 141 Ohio 60
- 3969 Town Line Road 187
- 816 Butler Rd S
- 52814 New London Eastern Rd
- 1293 Us Highway 224