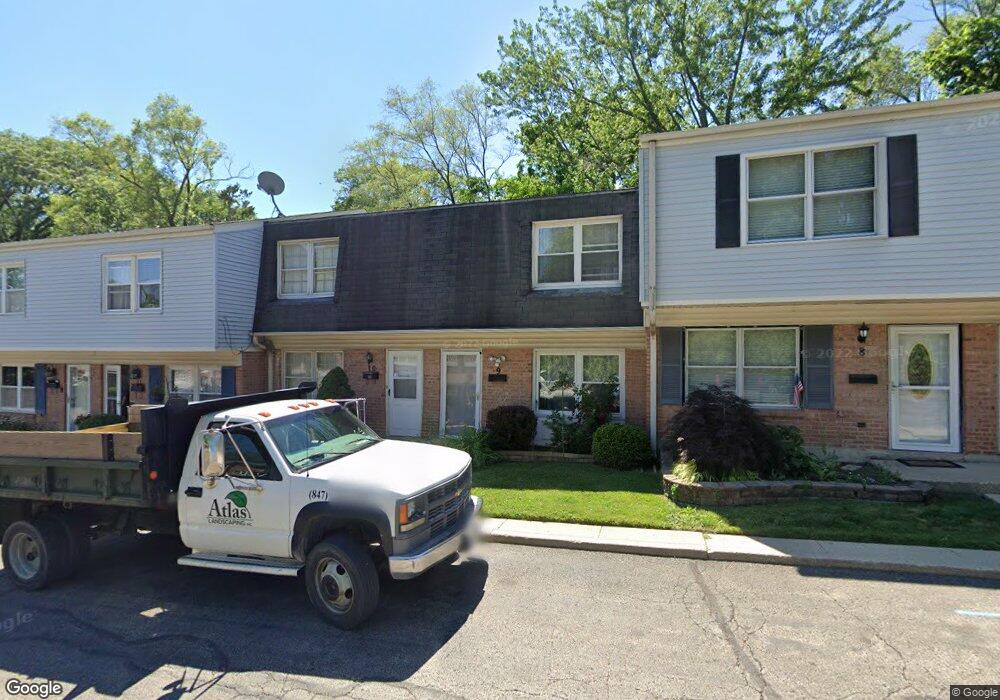
151 E Palatine Rd Palatine, IL 60067
Downtown Palatine NeighborhoodEstimated Value: $226,000 - $280,000
About This Home
This home is located at 151 E Palatine Rd, Palatine, IL 60067 and is currently estimated at $256,887, approximately $224 per square foot. 151 E Palatine Rd is a home located in Cook County with nearby schools including Gray M Sanborn Elementary School, Walter R. Sundling Junior High School, and Palatine High School.
Ownership History
We collect this data history from publicly available records. To have your information removed, we recommend requesting removal directly through your county’s website.
Purchase Details
Home Financials for this Owner
Home Financials are based on the most recent Mortgage that was taken out on this home.Purchase Details
Home Financials for this Owner
Home Financials are based on the most recent Mortgage that was taken out on this home.Purchase Details
Home Financials for this Owner
Home Financials are based on the most recent Mortgage that was taken out on this home.Home Values in the Area
Average Home Value in this Area
Purchase History
We collect this data history from publicly available records. To have your information removed, we recommend requesting removal directly through your county’s website.
| Date | Buyer | Sale Price | Title Company |
|---|---|---|---|
| $115,000 | Commonwealth Land Title Ins | ||
| $99,000 | -- | ||
| $55,333 | -- |
Mortgage History
We collect this data history from publicly available records. To have your information removed, we recommend requesting removal directly through your county’s website.
| Date | Status | Borrower | Loan Amount |
|---|---|---|---|
| Open | $111,550 | ||
| Previous Owner | $95,092 | ||
| Previous Owner | $74,700 |
Tax History
We collect this data history from publicly available records. To have your information removed, we recommend requesting removal directly through your county’s website.
| Year | Tax Paid | Tax Assessment Tax Assessment Total Assessment is a certain percentage of the fair market value that is determined by local assessors to be the total taxable value of land and additions on the property. | Land | Improvement |
|---|---|---|---|---|
| 2025 | $4,051 | $20,000 | $3,034 | $16,966 |
| 2024 | $4,051 | $17,000 | $4,000 | $13,000 |
| 2023 | $3,889 | $17,000 | $4,000 | $13,000 |
| 2022 | $3,889 | $17,000 | $4,000 | $13,000 |
| 2021 | $3,096 | $12,863 | $1,167 | $11,696 |
| 2020 | $3,123 | $12,863 | $1,167 | $11,696 |
| 2019 | $3,125 | $14,325 | $1,167 | $13,158 |
| 2018 | $2,149 | $10,349 | $1,050 | $9,299 |
| 2017 | $2,126 | $10,349 | $1,050 | $9,299 |
| 2016 | $4,037 | $16,736 | $1,050 | $15,686 |
| 2015 | $2,428 | $10,527 | $962 | $9,565 |
| 2014 | $2,416 | $10,527 | $962 | $9,565 |
| 2013 | $4,157 | $16,684 | $962 | $15,722 |
Map
- 167 E Palatine Rd Unit K
- 169 E Palatine Rd Unit J
- 169 E Palatine Rd Unit E
- 59 S Hale St Unit 103
- 23 N Benton St
- 142 S Fremont St
- 146 S Fremont St
- 158 S Benton St
- 149 N Hale St
- 104 N Plum Grove Rd Unit 504
- 226 S Plum Grove Rd
- 450 E Palatine Rd
- 312 S Oak St
- 493 E Palatine Rd
- 212 S Bothwell St
- 36 N Ashland Ave
- 133 W Palatine Rd Unit 312A
- 50 S Greeley St Unit 210
- 50 S Greeley St Unit 204
- 310 N Schiller St
- 151 E Palatine Rd
- 151 E Palatine Rd
- 151 E Palatine Rd
- 151 E Palatine Rd
- 151 E Palatine Rd
- 151 E Palatine Rd
- 151 E Palatine Rd
- 151 E Palatine Rd
- 151 E Palatine Rd
- 151 E Palatine Rd
- 151 E Palatine Rd
- 151 E Palatine Rd
- 151 E Palatine Rd
- 151 E Palatine Rd
- 151 E Palatine Rd
- 151 E Palatine Rd
- 151 E Palatine Rd
- 151 E Palatine Rd
- 151 E Palatine Rd
- 151 E Palatine Rd Unit 4
Ask me questions while you tour the home.