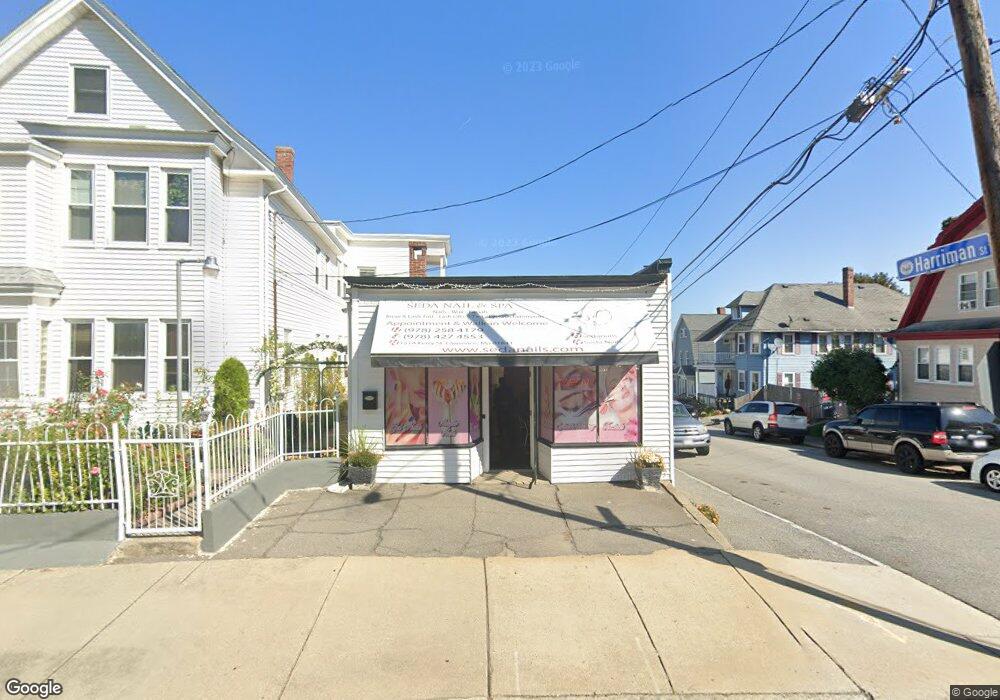
151 Ferry St Lawrence, MA 01841
Prospect Hill-Back Bay NeighborhoodEstimated Value: $477,872 - $657,000
3
Beds
2
Baths
1,560
Sq Ft
$361/Sq Ft
Est. Value
About This Home
This home is located at 151 Ferry St, Lawrence, MA 01841 and is currently estimated at $563,718, approximately $361 per square foot. 151 Ferry St is a home located in Essex County with nearby schools including School For Exceptional Studies, Community Day Charter Public School - Gateway, and Esperanza Academy School of Hope.
Ownership History
Date
Name
Owned For
Owner Type
Purchase Details
Closed on
Aug 1, 1997
Sold by
Dube Scott J
Bought by
Jones Robert R
Current Estimated Value
Home Financials for this Owner
Home Financials are based on the most recent Mortgage that was taken out on this home.
Original Mortgage
$89,000
Outstanding Balance
$13,352
Interest Rate
7.55%
Mortgage Type
Purchase Money Mortgage
Estimated Equity
$550,366
Purchase Details
Closed on
Jun 28, 1996
Sold by
Lanzafame Phyllis
Bought by
Dube Scott J
Home Financials for this Owner
Home Financials are based on the most recent Mortgage that was taken out on this home.
Original Mortgage
$83,947
Interest Rate
8.05%
Mortgage Type
Purchase Money Mortgage
Purchase Details
Closed on
Nov 23, 1987
Sold by
Lanzafame John W
Bought by
Lanzafame Samuel J
Create a Home Valuation Report for This Property
The Home Valuation Report is an in-depth analysis detailing your home's value as well as a comparison with similar homes in the area
Home Values in the Area
Average Home Value in this Area
Purchase History
| Date | Buyer | Sale Price | Title Company |
|---|---|---|---|
| Jones Robert R | $89,000 | -- | |
| Dube Scott J | $84,000 | -- | |
| Lanzafame Samuel J | $100,000 | -- |
Source: Public Records
Mortgage History
| Date | Status | Borrower | Loan Amount |
|---|---|---|---|
| Open | Lanzafame Samuel J | $31,671 | |
| Open | Lanzafame Samuel J | $89,000 | |
| Previous Owner | Lanzafame Samuel J | $83,947 |
Source: Public Records
Tax History
| Year | Tax Paid | Tax Assessment Tax Assessment Total Assessment is a certain percentage of the fair market value that is determined by local assessors to be the total taxable value of land and additions on the property. | Land | Improvement |
|---|---|---|---|---|
| 2025 | $3,525 | $400,600 | $120,800 | $279,800 |
| 2024 | $3,063 | $331,100 | $104,500 | $226,600 |
| 2023 | $3,477 | $342,200 | $104,500 | $237,700 |
| 2022 | $3,295 | $288,000 | $93,200 | $194,800 |
| 2021 | $3,172 | $258,500 | $93,200 | $165,300 |
| 2020 | $3,047 | $245,100 | $91,800 | $153,300 |
| 2019 | $2,885 | $210,900 | $73,400 | $137,500 |
| 2018 | $2,645 | $184,700 | $70,000 | $114,700 |
| 2017 | $2,511 | $163,700 | $64,500 | $99,200 |
| 2016 | $2,451 | $158,000 | $57,800 | $100,200 |
| 2015 | $2,214 | $146,400 | $46,200 | $100,200 |
Source: Public Records
Map
Nearby Homes
- 162 E Haverhill St
- 109 Ferry St
- 106 Leroy Ave
- 264 E Haverhill St Unit 2
- 39 Swan Ave
- 32 Josephine Ave
- 14 Court St
- 18 Erhardt Terrace
- 5 Kendrick St
- 12 Annette St
- 192 Union St
- 7 Erhardt Terrace
- 2 Cherry St
- 80-82 Haverhill St
- 89 Newbury St Unit 89B
- 27 Woodland Ct
- 25-27 Bicknell Ave
- 91 Summer St Unit 2
- 52 Howard St
- 7 Stevens Ct
- 151 Ferry St Unit 153A
- 155 Ferry St
- 149 Ferry St
- 13 Harriman St
- 1 Harriman St
- 157 Ferry St Unit 157A
- 6 Harriman St
- 147 Ferry St
- 5 Ridge Rd
- 4 Ridge Rd
- 159 Ferry St
- 5 Harriman St
- 5 Harriman St Unit B
- 24 William St
- 24 William St Unit 2
- 8 Harriman St
- 7 Harriman St Unit B
- 7 Harriman St Unit A
- 7 Harriman St Unit 7B
- 7 Harriman St Unit 7A
Your Personal Tour Guide
Ask me questions while you tour the home.