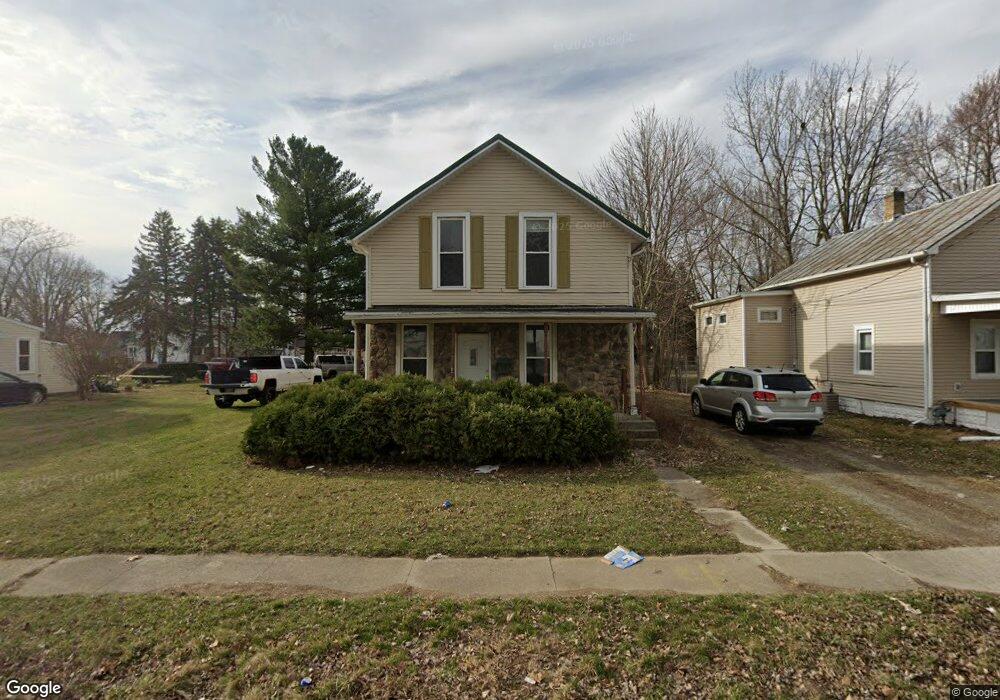
151 George St Findlay, OH 45840
Estimated Value: $121,000 - $146,000
3
Beds
1
Bath
1,332
Sq Ft
$101/Sq Ft
Est. Value
About This Home
This home is located at 151 George St, Findlay, OH 45840 and is currently estimated at $135,195, approximately $101 per square foot. 151 George St is a home located in Hancock County with nearby schools including Whittier Primary School, Bigelow Hill Elementary School, and Glenwood Middle School.
Ownership History
Date
Name
Owned For
Owner Type
Purchase Details
Closed on
Dec 15, 1998
Sold by
Bushong Daniel
Bought by
Schroeder Neal and Schroeder Duane
Current Estimated Value
Home Financials for this Owner
Home Financials are based on the most recent Mortgage that was taken out on this home.
Original Mortgage
$114,500
Interest Rate
7.75%
Mortgage Type
New Conventional
Purchase Details
Closed on
Jul 23, 1992
Bought by
Bushong Daniel J and Bushong Rhonda
Purchase Details
Closed on
Oct 12, 1989
Bought by
Thomas Judith Y
Purchase Details
Closed on
Mar 24, 1989
Bought by
Thomas Harold A
Purchase Details
Closed on
Jul 10, 1986
Bought by
Word Wayne W and Cheryl Ann
Purchase Details
Closed on
Feb 16, 1983
Bought by
Bish David W and Bish Deborah A
Purchase Details
Closed on
Apr 23, 1981
Bought by
Ogg Robert D and Ogg Dorothy J
Create a Home Valuation Report for This Property
The Home Valuation Report is an in-depth analysis detailing your home's value as well as a comparison with similar homes in the area
Home Values in the Area
Average Home Value in this Area
Purchase History
| Date | Buyer | Sale Price | Title Company |
|---|---|---|---|
| Schroeder Neal | $84,000 | -- | |
| Bushong Daniel J | $59,300 | -- | |
| Thomas Judith Y | -- | -- | |
| Thomas Harold A | $53,900 | -- | |
| Word Wayne W | $40,900 | -- | |
| Bish David W | $18,000 | -- | |
| Ogg Robert D | -- | -- |
Source: Public Records
Mortgage History
| Date | Status | Borrower | Loan Amount |
|---|---|---|---|
| Closed | Schroeder Neal | $114,500 |
Source: Public Records
Tax History
| Year | Tax Paid | Tax Assessment Tax Assessment Total Assessment is a certain percentage of the fair market value that is determined by local assessors to be the total taxable value of land and additions on the property. | Land | Improvement |
|---|---|---|---|---|
| 2024 | $1,230 | $33,740 | $4,850 | $28,890 |
| 2023 | $1,232 | $33,740 | $4,850 | $28,890 |
| 2022 | $1,228 | $33,740 | $4,850 | $28,890 |
| 2021 | $1,098 | $26,280 | $4,850 | $21,430 |
| 2020 | $1,098 | $26,280 | $4,850 | $21,430 |
| 2019 | $1,076 | $26,280 | $4,850 | $21,430 |
| 2018 | $1,025 | $22,960 | $4,220 | $18,740 |
| 2017 | $513 | $22,960 | $4,220 | $18,740 |
| 2016 | $1,021 | $22,960 | $4,220 | $18,740 |
| 2015 | $958 | $21,310 | $4,220 | $17,090 |
| 2014 | $959 | $21,310 | $4,220 | $17,090 |
| 2012 | $966 | $21,310 | $4,220 | $17,090 |
Source: Public Records
Map
Nearby Homes
- 204 Laquineo St
- 206 Midland Ave
- 301 Allen Ave
- 322 Midland Ave
- 706 N Cory St
- 145 Madison Ave
- 140 Monroe Ave
- 213 Cherry St
- 146 Clifton Ave
- 420 H St
- 1500 Crystal Ave
- 1820 Gayle Ln
- 421 Clifton Ave
- 716 Winfield Ave
- 232 Prentiss Ave
- 912 Parkside Place
- 705 Swing Ave
- 719 Davis St
- 1062 Vincent St
- 523 Center St
Your Personal Tour Guide
Ask me questions while you tour the home.