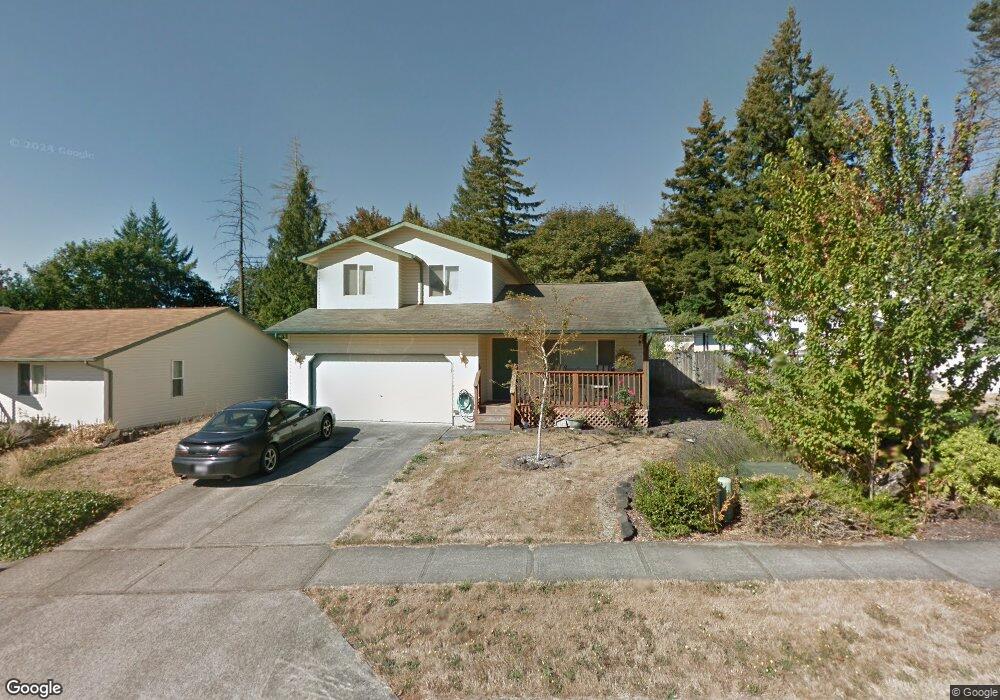
151 Greystone Rd Kalama, WA 98625
Estimated Value: $404,000 - $473,000
4
Beds
2
Baths
1,450
Sq Ft
$297/Sq Ft
Est. Value
About This Home
This home is located at 151 Greystone Rd, Kalama, WA 98625 and is currently estimated at $430,299, approximately $296 per square foot. 151 Greystone Rd is a home located in Cowlitz County with nearby schools including Kalama Elementary School, Kalama Middle School, and Kalama High School.
Ownership History
Date
Name
Owned For
Owner Type
Purchase Details
Closed on
Jan 26, 2018
Sold by
Forte Investment Advisor Llc
Bought by
Taylor Misty J and White Henry O
Current Estimated Value
Home Financials for this Owner
Home Financials are based on the most recent Mortgage that was taken out on this home.
Original Mortgage
$277,874
Outstanding Balance
$239,665
Interest Rate
4.75%
Mortgage Type
FHA
Estimated Equity
$190,634
Purchase Details
Closed on
Jan 25, 2018
Sold by
Forte Investments Advisor Llc
Bought by
Taylor Misty J and White Henry O
Home Financials for this Owner
Home Financials are based on the most recent Mortgage that was taken out on this home.
Original Mortgage
$277,874
Outstanding Balance
$239,665
Interest Rate
4.75%
Mortgage Type
FHA
Estimated Equity
$190,634
Purchase Details
Closed on
May 25, 2017
Sold by
Sandretto Rhonda M and Sandretto Terry
Bought by
Forte Investment Advisors Llc
Create a Home Valuation Report for This Property
The Home Valuation Report is an in-depth analysis detailing your home's value as well as a comparison with similar homes in the area
Home Values in the Area
Average Home Value in this Area
Purchase History
| Date | Buyer | Sale Price | Title Company |
|---|---|---|---|
| Taylor Misty J | -- | Chicago Title | |
| Taylor Misty J | $283,000 | Chicago Title | |
| Forte Investment Advisors Llc | $201,000 | None Available |
Source: Public Records
Mortgage History
| Date | Status | Borrower | Loan Amount |
|---|---|---|---|
| Open | Taylor Misty J | $277,874 | |
| Closed | Taylor Misty J | $277,874 |
Source: Public Records
Tax History Compared to Growth
Tax History
| Year | Tax Paid | Tax Assessment Tax Assessment Total Assessment is a certain percentage of the fair market value that is determined by local assessors to be the total taxable value of land and additions on the property. | Land | Improvement |
|---|---|---|---|---|
| 2024 | $3,170 | $364,300 | $58,630 | $305,670 |
| 2023 | $3,008 | $367,520 | $58,630 | $308,890 |
| 2022 | $2,863 | $350,320 | $58,630 | $291,690 |
| 2021 | $2,832 | $289,210 | $55,320 | $233,890 |
| 2020 | $2,472 | $266,880 | $48,100 | $218,780 |
| 2019 | $2,291 | $226,759 | $48,069 | $178,690 |
| 2018 | $1,926 | $207,330 | $48,070 | $159,260 |
| 2017 | $1,588 | $188,000 | $45,780 | $142,220 |
| 2016 | $1,528 | $161,470 | $42,000 | $119,470 |
| 2015 | $1,529 | $154,380 | $42,000 | $112,380 |
| 2013 | -- | $123,610 | $44,670 | $78,940 |
Source: Public Records
Map
Nearby Homes
- 406 Chehalis
- 900 China Garden Rd
- 1002 Cedar St
- 202 Rocky Meadow Dr
- 411 Stepping Stone St
- 612 Stone View Way
- 105 Cedar Springs Loop
- 6420 Old Pacific Hwy S Unit 8
- 272 Military Rd
- 0 China Garden Rd Unit NWM2134431
- 0 China Garden Rd Unit NWM2134430
- 0 China Garden Rd Unit A 23261722
- 0 China Garden Rd Unit D 23142846
- 0 China Garden Rd Unit B 23521969
- 0 China Garden Rd Unit NWM2134432
- 11 Ashland St
- 1045 Taylor Rd
- 155 Elm St
- 160 S 1st St
- 105 Eli Avery Ave
- 153 Greystone Rd
- 149 Greystone Rd
- 147 Greystone Rd
- 157 Greystone Rd
- 148 Greystone Rd
- 154 Graystone Rd
- 145 Graystone Rd
- 146 Graystone Rd
- 152 Greystone Rd
- 140 Ashland Ct
- 140 Ashland Ct
- 146 Greystone Rd
- 154 Greystone Rd
- 145 Greystone Rd
- 145 Greystone Rd Unit 34
- 1175 Ashland St
- 156 Greystone Rd
- 144 Greystone Rd
- 1135 Ashland St
- 130 Ashland Ct