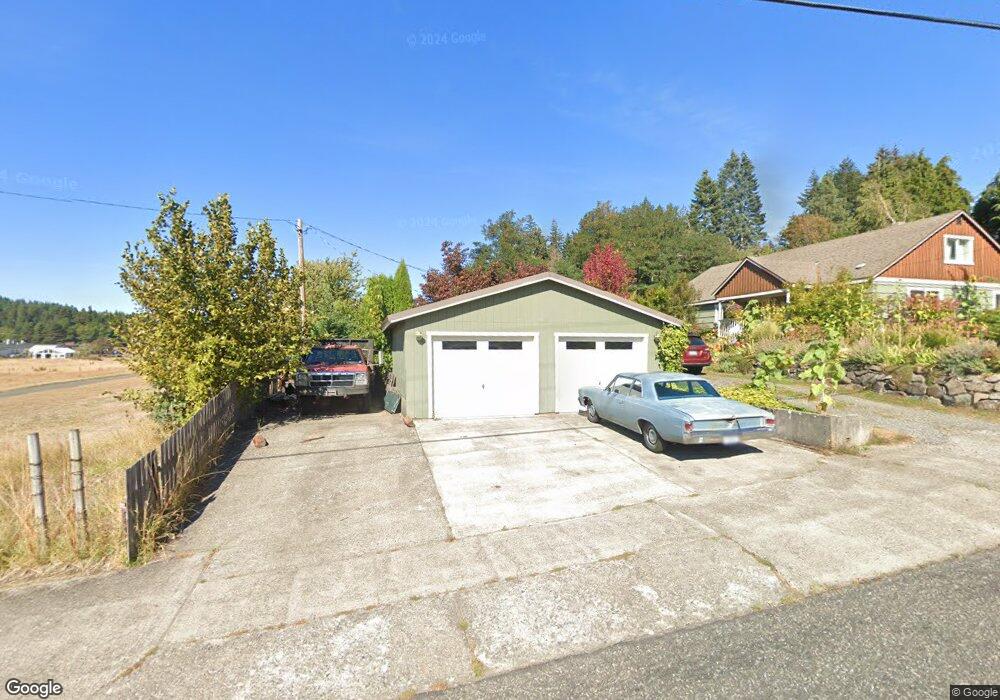
151 Hot Springs Ave Carson, WA 98610
Estimated Value: $353,000 - $464,000
4
Beds
2
Baths
2,496
Sq Ft
$170/Sq Ft
Est. Value
About This Home
This home is located at 151 Hot Springs Ave, Carson, WA 98610 and is currently estimated at $425,202, approximately $170 per square foot. 151 Hot Springs Ave is a home located in Skamania County with nearby schools including Carson Elementary School, Stevenson Elementary School, and Wind River Middle School.
Ownership History
Date
Name
Owned For
Owner Type
Purchase Details
Closed on
Apr 22, 2016
Sold by
Rochefort Kenneth A and Rochefort Tammie M
Bought by
Throop Aaron R
Current Estimated Value
Home Financials for this Owner
Home Financials are based on the most recent Mortgage that was taken out on this home.
Original Mortgage
$128,250
Outstanding Balance
$54,551
Interest Rate
2.99%
Mortgage Type
New Conventional
Estimated Equity
$370,651
Purchase Details
Closed on
Dec 10, 2015
Sold by
Jpmorgan Chase Bank Na
Bought by
Rochefort Kenneth A and Rochefort Tammie M
Purchase Details
Closed on
Mar 30, 2015
Sold by
Northwest Trustee Services Inc
Bought by
Jpmorgan Chase Bank
Purchase Details
Closed on
Jan 13, 2010
Sold by
Delude Darian W and Delude Regina E
Bought by
Mullican Matthew
Home Financials for this Owner
Home Financials are based on the most recent Mortgage that was taken out on this home.
Original Mortgage
$186,810
Interest Rate
4.68%
Mortgage Type
New Conventional
Create a Home Valuation Report for This Property
The Home Valuation Report is an in-depth analysis detailing your home's value as well as a comparison with similar homes in the area
Home Values in the Area
Average Home Value in this Area
Purchase History
| Date | Buyer | Sale Price | Title Company |
|---|---|---|---|
| Throop Aaron R | $135,000 | Columbia Gorge Title | |
| Rochefort Kenneth A | $110,000 | None Available | |
| Jpmorgan Chase Bank | $152,000 | Columbia Gorge Title | |
| Mullican Matthew | $183,000 | Skamania County Title Compan |
Source: Public Records
Mortgage History
| Date | Status | Borrower | Loan Amount |
|---|---|---|---|
| Open | Throop Aaron R | $128,250 | |
| Previous Owner | Mullican Matthew | $186,810 |
Source: Public Records
Tax History Compared to Growth
Tax History
| Year | Tax Paid | Tax Assessment Tax Assessment Total Assessment is a certain percentage of the fair market value that is determined by local assessors to be the total taxable value of land and additions on the property. | Land | Improvement |
|---|---|---|---|---|
| 2025 | $3,083 | $373,000 | $95,000 | $278,000 |
| 2024 | $2,905 | $344,100 | $83,100 | $261,000 |
| 2023 | $2,606 | $308,100 | $68,100 | $240,000 |
| 2022 | $2,607 | $270,100 | $60,500 | $209,600 |
| 2021 | $2,265 | $219,600 | $58,500 | $161,100 |
| 2020 | $2,282 | $219,600 | $58,500 | $161,100 |
| 2019 | $1,827 | $192,300 | $53,500 | $138,800 |
| 2018 | $2,077 | $192,300 | $53,500 | $138,800 |
| 2017 | $1,512 | $173,000 | $48,500 | $124,500 |
| 2015 | $1,737 | $173,000 | $43,500 | $129,500 |
| 2013 | -- | $173,000 | $43,500 | $129,500 |
Source: Public Records
Map
Nearby Homes
- 72 Cheryl Ln
- 291 Metzger Rd
- 52 Wallace Creek Rd
- 12 Short Run Rd
- 271 Old Airport Rd
- 0 Wallace Creek Rd
- 62 Wallace Creek Rd
- 0 Carson Depot Rd
- 564 Hot Springs Ave
- 121 Rosenbach Ln
- 722 Smith Beacon Rd
- 181 Vada St
- 111 Mathany Rd
- 81 Mathany Rd
- 0 Kelly-Henke Rd
- 21 Cochran Rd
- 21 Cochran Ln
- 372 Wind Mountain Rd
- 162 Bylin Rd
- 3031 Loop Rd
- 152 Hot Springs Ave
- 152 Spring Ln Unit HOT
- 211 Hot Springs Ave
- 31 Third St
- 132 Hot Springs Ave
- 132 Spring Ln Unit HOT
- 12 Fourth St
- 11 2nd St
- 11 Second St
- 92 Four Ks Ln
- 32 4th St
- 11 Fourth St
- 12 Second St
- 232 Hot Springs Ave
- 81 Hot Springs Ave
- 241 Hot Springs Ave
- 31 Fourth St
- 61 Metzger Rd
- 41 Fourth St
- 242 Hot Springs Ave