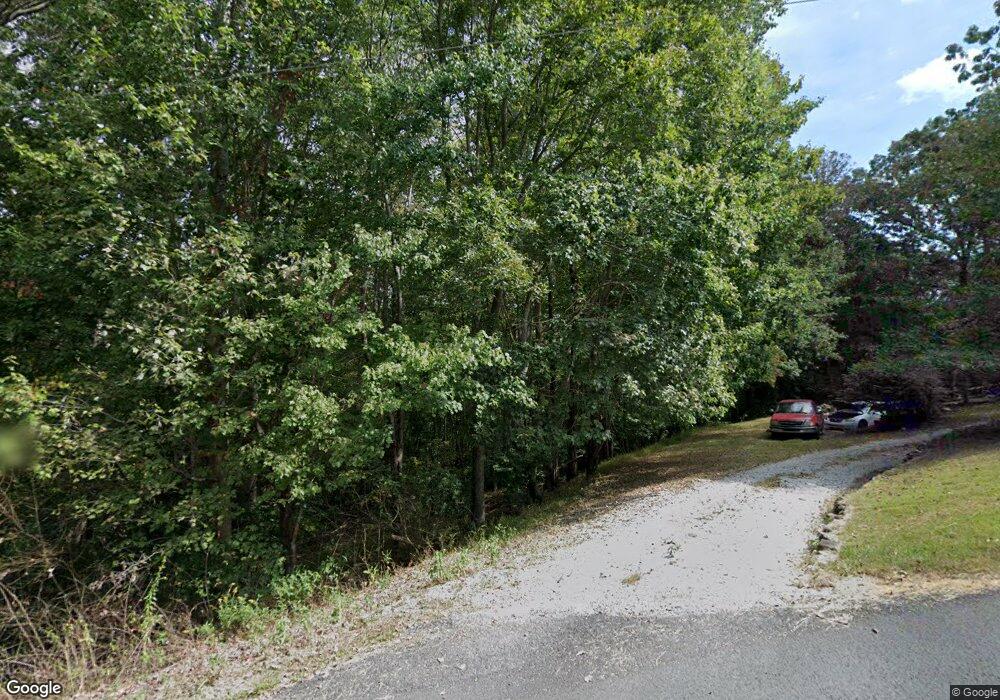
151 Ivy Terrace Dahlonega, GA 30533
Estimated Value: $270,085 - $330,000
--
Bed
2
Baths
1,296
Sq Ft
$236/Sq Ft
Est. Value
About This Home
This home is located at 151 Ivy Terrace, Dahlonega, GA 30533 and is currently estimated at $306,271, approximately $236 per square foot. 151 Ivy Terrace is a home located in Lumpkin County with nearby schools including Lumpkin County High School.
Ownership History
Date
Name
Owned For
Owner Type
Purchase Details
Closed on
Nov 22, 2013
Sold by
Talton Sandra
Bought by
Maddox Sandra Talton
Current Estimated Value
Home Financials for this Owner
Home Financials are based on the most recent Mortgage that was taken out on this home.
Original Mortgage
$116,626
Outstanding Balance
$59,455
Interest Rate
4.16%
Mortgage Type
VA
Estimated Equity
$246,816
Purchase Details
Closed on
Feb 25, 2008
Sold by
Anderson Marvin
Bought by
Anderson Clark and Anderson Mark
Purchase Details
Closed on
Jul 20, 2005
Sold by
House Joseph P
Bought by
Talton Sandra
Home Financials for this Owner
Home Financials are based on the most recent Mortgage that was taken out on this home.
Original Mortgage
$130,752
Interest Rate
5.51%
Mortgage Type
VA
Purchase Details
Closed on
Apr 12, 2002
Sold by
House Joseph P
Bought by
House Joseph P
Purchase Details
Closed on
Jun 17, 1996
Sold by
Vanaelst Alphense J
Bought by
House Joseph P
Purchase Details
Closed on
Jan 1, 1980
Bought by
Vanaelst Alphense J
Create a Home Valuation Report for This Property
The Home Valuation Report is an in-depth analysis detailing your home's value as well as a comparison with similar homes in the area
Home Values in the Area
Average Home Value in this Area
Purchase History
| Date | Buyer | Sale Price | Title Company |
|---|---|---|---|
| Maddox Sandra Talton | -- | -- | |
| Anderson Clark | -- | -- | |
| Talton Sandra | $128,000 | -- | |
| House Joseph P | -- | -- | |
| House Joseph P | $83,000 | -- | |
| Vanaelst Alphense J | -- | -- |
Source: Public Records
Mortgage History
| Date | Status | Borrower | Loan Amount |
|---|---|---|---|
| Open | Maddox Sandra Talton | $116,626 | |
| Previous Owner | Talton Sandra | $130,752 |
Source: Public Records
Tax History Compared to Growth
Tax History
| Year | Tax Paid | Tax Assessment Tax Assessment Total Assessment is a certain percentage of the fair market value that is determined by local assessors to be the total taxable value of land and additions on the property. | Land | Improvement |
|---|---|---|---|---|
| 2024 | $1,583 | $69,824 | $22,850 | $46,974 |
| 2023 | $1,112 | $66,822 | $22,850 | $43,972 |
| 2022 | $1,452 | $60,636 | $19,046 | $41,590 |
| 2021 | $1,328 | $53,881 | $19,046 | $34,835 |
| 2020 | $1,324 | $52,179 | $18,250 | $33,929 |
| 2019 | $1,336 | $52,179 | $18,250 | $33,929 |
| 2018 | $1,311 | $48,213 | $18,250 | $29,963 |
| 2017 | $1,337 | $48,216 | $18,250 | $29,966 |
| 2016 | $1,271 | $44,510 | $18,250 | $26,260 |
| 2015 | $1,144 | $44,510 | $18,250 | $26,260 |
| 2014 | $1,144 | $45,376 | $18,250 | $27,126 |
| 2013 | -- | $46,242 | $18,250 | $27,992 |
Source: Public Records
Map
Nearby Homes
- 1202 Oak Grove Rd
- 132 J Mountain Dr
- 549 Ivy Terrace
- 100 Sanders Blvd
- 120 Sanders Blvd
- 121 Blair Ridge Rd
- 120 Blair Ridge Rd
- 253 Blair Ridge Rd
- 64 Hickory Ln
- 70 Avery Trail
- 490 N Hall Rd
- 0 Dawsonville Hwy Unit 10631159
- 00 Dawsonville Hwy
- 0 Woodland Ln Unit 10570991
- 7B Strada Valdichiana
- 114 Funaro Ln
- 931 Homer Edwards Rd
- 357 Camp Wahsega Rd
- 0 Camp Wahsega Rd Unit 7600956
- 187 Ivy Terrace
- 162 Ivy Terrace
- 140 Ivy Terrace
- 225 Ivy Terrace
- 35 Ivy Terrace
- 110 Ivy Terrace
- 5 J Mountain Dr
- 3 J Mountain Dr
- 1 J Mountain Dr
- 267 Ivy Terrace
- 45 Jay Mountain Dr
- 45 J Mountain Dr
- 63 J Mountain Dr
- 1315 Oak Grove Rd
- 0 J Mountain Dr Unit 7329220
- 0 J Mountain Dr Unit 8125358
- 0 J Mountain Dr
- 0 J Mountain Dr Unit 4339070
- 0 J Mountain Dr Unit 6543522
- 20 J Mountain Dr