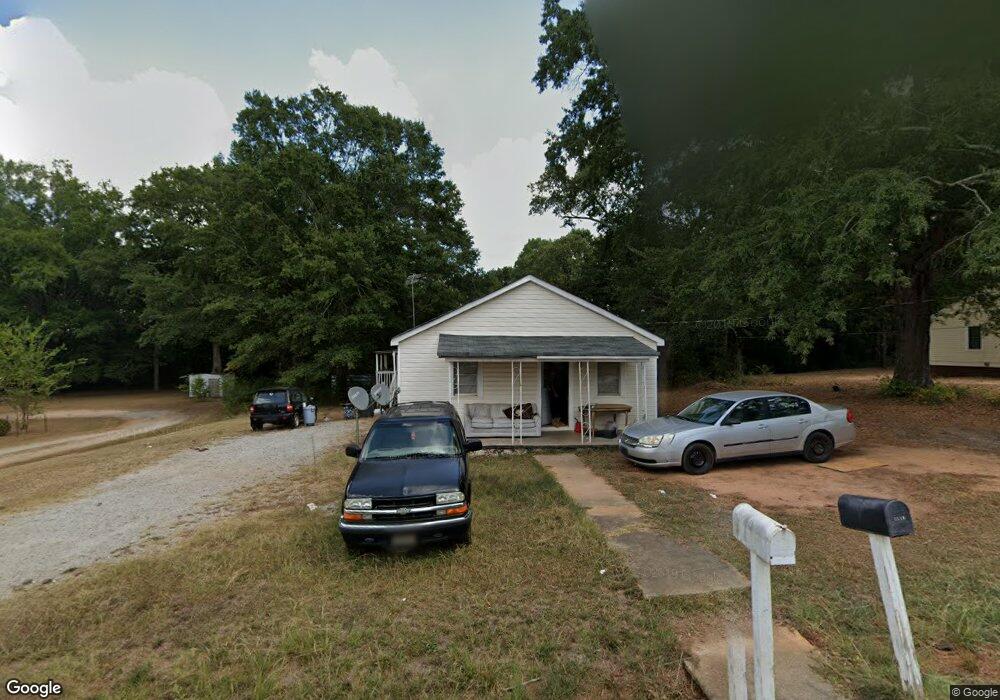
151 Johnson St Barnesville, GA 30204
Estimated Value: $96,000 - $125,000
4
Beds
2
Baths
1,525
Sq Ft
$71/Sq Ft
Est. Value
About This Home
This home is located at 151 Johnson St, Barnesville, GA 30204 and is currently estimated at $108,049, approximately $70 per square foot. 151 Johnson St is a home with nearby schools including Lamar County Primary School, Lamar County Elementary School, and Lamar County Middle School.
Ownership History
Date
Name
Owned For
Owner Type
Purchase Details
Closed on
Jun 5, 2024
Sold by
Lacey Holdings Llc
Bought by
Tolt Investments Llc
Current Estimated Value
Purchase Details
Closed on
Mar 1, 2021
Sold by
Buck Ridge Properties Llc
Bought by
Lacey Holdings Llc
Purchase Details
Closed on
Jul 31, 2008
Sold by
Smith Destin E
Bought by
Buckridge Properties Llc
Purchase Details
Closed on
Jul 3, 2007
Sold by
Leverett Fam Investment
Bought by
Smith Destin E
Home Financials for this Owner
Home Financials are based on the most recent Mortgage that was taken out on this home.
Original Mortgage
$50,940
Interest Rate
6.52%
Mortgage Type
New Conventional
Purchase Details
Closed on
Jun 26, 2006
Sold by
Not Provided
Bought by
Buck Ridge Properties Llc
Purchase Details
Closed on
Nov 22, 1999
Sold by
Whittington Donald
Bought by
Whittington Donald
Create a Home Valuation Report for This Property
The Home Valuation Report is an in-depth analysis detailing your home's value as well as a comparison with similar homes in the area
Home Values in the Area
Average Home Value in this Area
Purchase History
| Date | Buyer | Sale Price | Title Company |
|---|---|---|---|
| Tolt Investments Llc | -- | -- | |
| Lacey Holdings Llc | $57,500 | -- | |
| Buckridge Properties Llc | -- | -- | |
| Smith Destin E | $42,900 | -- | |
| Buck Ridge Properties Llc | $32,000 | -- | |
| Whittington Donald | -- | -- |
Source: Public Records
Mortgage History
| Date | Status | Borrower | Loan Amount |
|---|---|---|---|
| Previous Owner | Smith Destin E | $50,940 |
Source: Public Records
Tax History Compared to Growth
Tax History
| Year | Tax Paid | Tax Assessment Tax Assessment Total Assessment is a certain percentage of the fair market value that is determined by local assessors to be the total taxable value of land and additions on the property. | Land | Improvement |
|---|---|---|---|---|
| 2025 | $814 | $32,140 | $3,600 | $28,540 |
| 2024 | $814 | $28,420 | $3,600 | $24,820 |
| 2023 | $877 | $28,420 | $3,600 | $24,820 |
| 2022 | $635 | $27,326 | $3,600 | $23,726 |
| 2021 | $663 | $22,041 | $3,640 | $18,401 |
| 2020 | $765 | $24,160 | $3,640 | $20,520 |
| 2019 | $767 | $24,160 | $3,640 | $20,520 |
| 2018 | $562 | $18,437 | $3,640 | $14,797 |
| 2017 | $559 | $18,437 | $3,640 | $14,797 |
| 2016 | $559 | $18,437 | $3,640 | $14,797 |
| 2015 | $558 | $18,437 | $3,640 | $14,797 |
| 2014 | $541 | $18,437 | $3,640 | $14,797 |
| 2013 | -- | $18,436 | $3,640 | $14,796 |
Source: Public Records
Map
Nearby Homes
- 13 Brown St
- 0 Washington Cir
- 295 Grove St
- 420 Zebulon St
- 339 Atlanta St
- 245 Atlanta St
- 500 Rose Ave
- 125 Byrd St
- 531 Thomaston St
- 0 Mill St Unit 10420113
- 4 Jackson St
- 250 Mill St
- 107 1st St
- 101 3rd St
- 150 Georgia Ave
- 0 Old Milner Rd Unit 10630085
- 202 Northside Dr
- 303 Carleeta St
- 205 Georgia Ave
- 746 Highway 18 W
- 0 Johnson St Unit 20172821
- 0 Johnson St Unit 8051104
- 0 Johnson St
- 147 Johnson St
- 157 Johnson St
- 146 Johnson St
- 7 Ware St
- 144 Johnson St
- 5 Ware St
- 142 Johnson St
- 138 Johnson St
- 104 Westchester Dr
- 106 Westchester Dr
- 3 Ware St
- 108 Westchester Dr
- 165 Johnson St
- 139 Johnson St
- 102 Westchester Dr
- 153 Church St
- 112 Westchester Dr