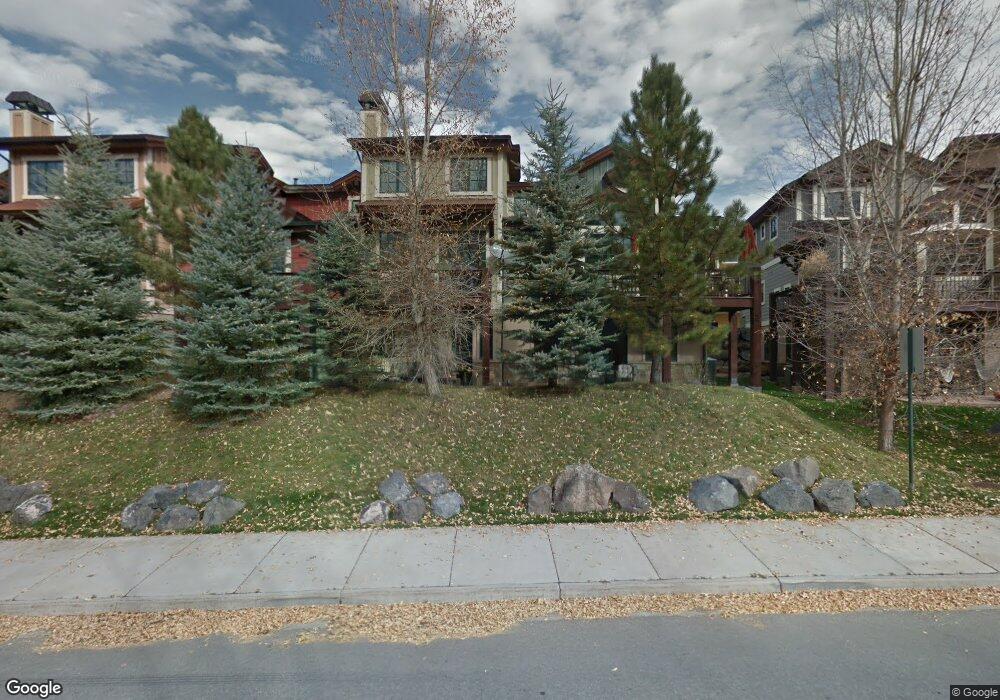
151 Juniper Trail Unit Sundance Carbondale, CO 81623
Estimated Value: $1,424,000 - $1,562,000
3
Beds
3
Baths
2,273
Sq Ft
$663/Sq Ft
Est. Value
About This Home
This home is located at 151 Juniper Trail Unit Sundance, Carbondale, CO 81623 and is currently estimated at $1,506,117, approximately $662 per square foot. 151 Juniper Trail Unit Sundance is a home located in Eagle County with nearby schools including Cornerstone Classical School and Waldorf School on the Roaring Fork.
Ownership History
Date
Name
Owned For
Owner Type
Purchase Details
Closed on
Oct 28, 2014
Sold by
Marcinkowski Brian J
Bought by
Trom Steven Joseph
Current Estimated Value
Home Financials for this Owner
Home Financials are based on the most recent Mortgage that was taken out on this home.
Original Mortgage
$547,500
Outstanding Balance
$421,865
Interest Rate
4.16%
Mortgage Type
Purchase Money Mortgage
Estimated Equity
$1,084,252
Purchase Details
Closed on
Apr 25, 2012
Sold by
Weinglass Lenny
Bought by
Marcinkowski Brian J
Home Financials for this Owner
Home Financials are based on the most recent Mortgage that was taken out on this home.
Original Mortgage
$405,000
Interest Rate
4.02%
Mortgage Type
New Conventional
Purchase Details
Closed on
Mar 21, 2008
Sold by
Blue Ridge Investments Ltd
Bought by
Weinglass Lenny
Create a Home Valuation Report for This Property
The Home Valuation Report is an in-depth analysis detailing your home's value as well as a comparison with similar homes in the area
Home Values in the Area
Average Home Value in this Area
Purchase History
| Date | Buyer | Sale Price | Title Company |
|---|---|---|---|
| Trom Steven Joseph | $547,500 | Title Company Of The Rockies | |
| Marcinkowski Brian J | $430,000 | None Available | |
| Weinglass Lenny | $989,200 | Stewart Title |
Source: Public Records
Mortgage History
| Date | Status | Borrower | Loan Amount |
|---|---|---|---|
| Open | Trom Steven Joseph | $547,500 | |
| Previous Owner | Marcinkowski Brian J | $405,000 |
Source: Public Records
Tax History Compared to Growth
Tax History
| Year | Tax Paid | Tax Assessment Tax Assessment Total Assessment is a certain percentage of the fair market value that is determined by local assessors to be the total taxable value of land and additions on the property. | Land | Improvement |
|---|---|---|---|---|
| 2024 | $5,793 | $77,610 | $9,250 | $68,360 |
| 2023 | $5,793 | $77,610 | $9,250 | $68,360 |
| 2022 | $4,514 | $55,960 | $6,650 | $49,310 |
| 2021 | $4,638 | $57,570 | $6,840 | $50,730 |
| 2020 | $3,711 | $48,340 | $5,730 | $42,610 |
| 2019 | $3,746 | $48,340 | $5,730 | $42,610 |
| 2018 | $3,894 | $49,780 | $5,900 | $43,880 |
| 2017 | $3,688 | $49,780 | $5,900 | $43,880 |
| 2016 | $3,519 | $46,670 | $5,520 | $41,150 |
| 2015 | -- | $46,670 | $5,520 | $41,150 |
| 2014 | $2,400 | $33,470 | $3,940 | $29,530 |
Source: Public Records
Map
Nearby Homes
- 145 Juniper Trail
- 140 Juniper Trail Unit 140
- 201 Tree Farm Dr Unit The Creekside
- 201 Tree Farm Dr Unit All Parcels
- 201 Tree Farm Dr Unit The Lakeview
- TBD Tree Farm Dr Unit A4 - 201
- TBD Tree Farm Dr Unit A1-302
- TBD Tree Farm Dr Unit A2 - 301
- TBD Tree Farm Dr Unit A4 - 202
- TBD Tree Farm Dr Unit A1-202
- TBD Tree Farm Dr Unit The Edge at Tree Far
- TBD Tree Farm Dr Unit A1-203
- TBD Tree Farm Dr Unit A3 - 301
- TBD Tree Farm Dr Unit A1-301
- TBD Tree Farm Dr Unit A3 -201
- TBD Tree Farm Dr Unit A-2 302
- TBD Tree Farm Dr Unit A2-201
- TBD Tree Farm Dr Unit A1-201
- TBD Tree Farm Dr Unit A2-202
- TBD Tree Farm Dr Unit A4 - 301
- 151 Juniper Trail
- 153 Juniper Trail
- 153 Juniper Trail Unit Larkspur
- 145 Juniper Trail Unit Sundance
- 143 Juniper Trail Unit K143
- 143 Juniper Trail Unit Larkspur
- 155 Juniper Trail
- 155 Juniper Trail Unit Sundance
- 143 Juniper Trail
- 155 Juniper Trail
- 363 Park Meadows Ln
- 141 Juniper Trail
- 141 Juniper Trail Unit Sundance
- 161 Juniper Trail Unit M161
- 161 Juniper Trail Unit Sundance
- 156 Juniper Trail
- 156 Juniper Trail Unit Firelight
- 158 Juniper Trail Unit 158
- 158 Juniper Trail Unit Skywatch Floor Plan
- 158 Juniper Trail Unit Skywatch