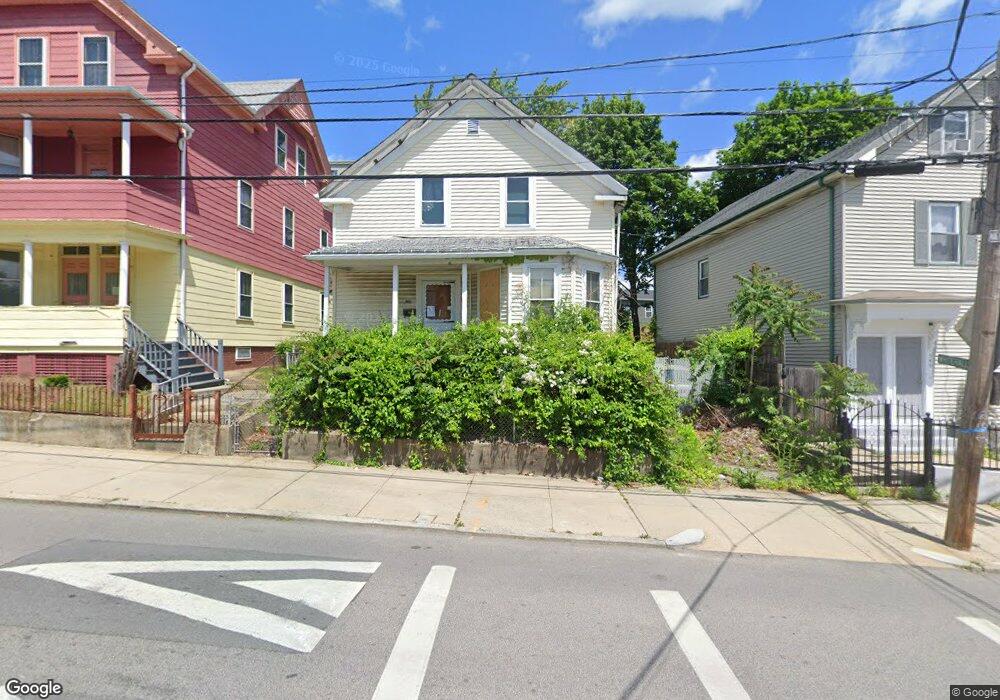
151 Magnolia St Providence, RI 02909
Silver Lake NeighborhoodEstimated Value: $383,000 - $405,160
4
Beds
2
Baths
1,704
Sq Ft
$232/Sq Ft
Est. Value
About This Home
This home is located at 151 Magnolia St, Providence, RI 02909 and is currently estimated at $395,290, approximately $231 per square foot. 151 Magnolia St is a home located in Providence County with nearby schools including Charles N. Fortes Elementary School, Asa Messer Elementary School, and Laurel Hill Annex School.
Ownership History
Date
Name
Owned For
Owner Type
Purchase Details
Closed on
Jul 1, 2025
Sold by
Providence City Of
Bought by
Ri Houisng & Mtg Fin Corp
Current Estimated Value
Purchase Details
Closed on
Jul 2, 2024
Sold by
Providence City Of
Bought by
Ri Hsng & Mtg & Fin Corp
Purchase Details
Closed on
Mar 22, 2019
Sold by
Dzikiewicz Anthony
Bought by
Dzikiewicz Anthony
Create a Home Valuation Report for This Property
The Home Valuation Report is an in-depth analysis detailing your home's value as well as a comparison with similar homes in the area
Home Values in the Area
Average Home Value in this Area
Purchase History
| Date | Buyer | Sale Price | Title Company |
|---|---|---|---|
| Ri Houisng & Mtg Fin Corp | $2,412 | -- | |
| Ri Houisng & Mtg Fin Corp | $2,412 | -- | |
| Ri Houisng & Mtg Fin Corp | $2,412 | -- | |
| Ri Hsng & Mtg & Fin Corp | $2,412 | None Available | |
| Ri Hsng & Mtg & Fin Corp | $2,412 | None Available | |
| Ri Hsng & Mtg & Fin Corp | $2,412 | None Available | |
| Ri Hsng & Mtg & Fin Corp | $2,412 | None Available | |
| Dzikiewicz Anthony | -- | -- | |
| Dzikiewicz Anthony | -- | -- | |
| Dzikiewicz Anthony | -- | -- |
Source: Public Records
Tax History Compared to Growth
Tax History
| Year | Tax Paid | Tax Assessment Tax Assessment Total Assessment is a certain percentage of the fair market value that is determined by local assessors to be the total taxable value of land and additions on the property. | Land | Improvement |
|---|---|---|---|---|
| 2025 | $2,759 | $328,500 | $128,000 | $200,500 |
| 2024 | $4,338 | $236,400 | $72,000 | $164,400 |
| 2023 | $4,338 | $236,400 | $72,000 | $164,400 |
| 2022 | $4,208 | $236,400 | $72,000 | $164,400 |
| 2021 | $3,731 | $151,900 | $45,800 | $106,100 |
| 2020 | $3,731 | $151,900 | $45,800 | $106,100 |
| 2019 | $3,731 | $151,900 | $45,800 | $106,100 |
| 2018 | $3,656 | $114,400 | $44,400 | $70,000 |
| 2017 | $3,656 | $114,400 | $44,400 | $70,000 |
| 2016 | $3,656 | $114,400 | $44,400 | $70,000 |
| 2015 | $3,780 | $114,200 | $47,100 | $67,100 |
| 2014 | $3,854 | $114,200 | $47,100 | $67,100 |
| 2013 | $3,854 | $114,200 | $47,100 | $67,100 |
Source: Public Records
Map
Nearby Homes