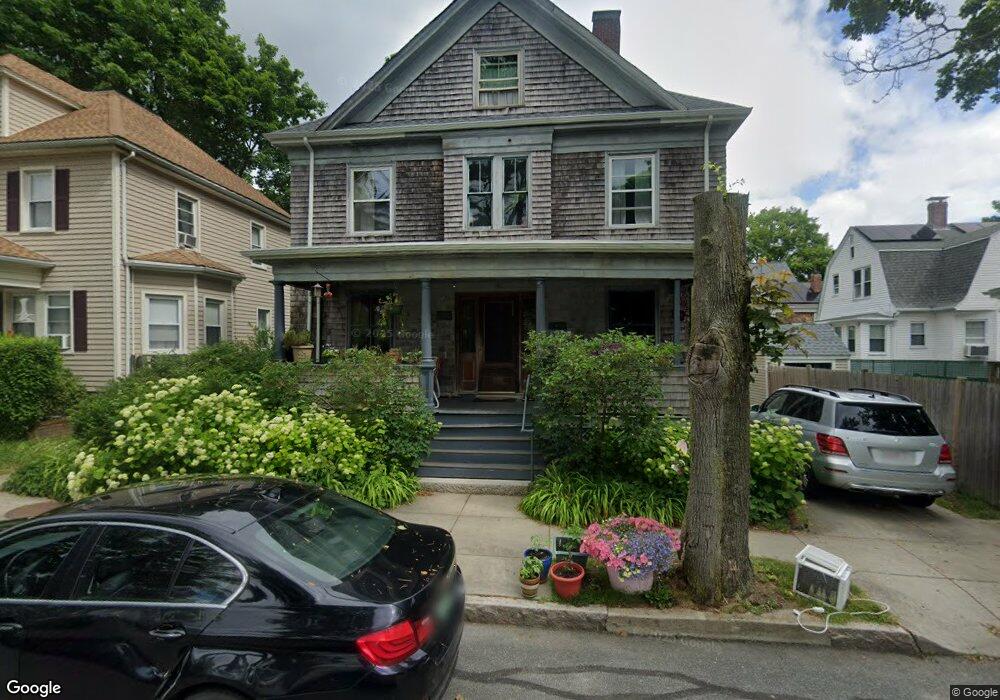
151 Maple St New Bedford, MA 02740
Downtown New Bedford NeighborhoodEstimated Value: $424,896 - $506,000
5
Beds
2
Baths
2,130
Sq Ft
$218/Sq Ft
Est. Value
About This Home
This home is located at 151 Maple St, New Bedford, MA 02740 and is currently estimated at $464,224, approximately $217 per square foot. 151 Maple St is a home located in Bristol County with nearby schools including Ellen R. Hathaway Elementary School, Keith Middle School, and New Bedford High School.
Ownership History
Date
Name
Owned For
Owner Type
Purchase Details
Closed on
Jun 18, 2001
Sold by
Mcgee Glenn E
Bought by
Bell David N
Current Estimated Value
Purchase Details
Closed on
Jun 30, 1994
Sold by
Evans Hilmer E and Evans Mary Ellen
Bought by
Mcgee Glenn E and Mcgee Shannon
Purchase Details
Closed on
May 9, 1989
Sold by
Brunelle Ellen E
Bought by
Evans Hilmer E
Create a Home Valuation Report for This Property
The Home Valuation Report is an in-depth analysis detailing your home's value as well as a comparison with similar homes in the area
Home Values in the Area
Average Home Value in this Area
Purchase History
| Date | Buyer | Sale Price | Title Company |
|---|---|---|---|
| Bell David N | $130,000 | -- | |
| Bell David N | $130,000 | -- | |
| Mcgee Glenn E | $122,500 | -- | |
| Mcgee Glenn E | $122,500 | -- | |
| Evans Hilmer E | $143,500 | -- |
Source: Public Records
Mortgage History
| Date | Status | Borrower | Loan Amount |
|---|---|---|---|
| Open | Evans Hilmer E | $237,445 | |
| Closed | Evans Hilmer E | $216,000 | |
| Closed | Evans Hilmer E | $63,000 |
Source: Public Records
Tax History
| Year | Tax Paid | Tax Assessment Tax Assessment Total Assessment is a certain percentage of the fair market value that is determined by local assessors to be the total taxable value of land and additions on the property. | Land | Improvement |
|---|---|---|---|---|
| 2025 | $3,741 | $330,800 | $97,100 | $233,700 |
| 2024 | $3,901 | $325,100 | $98,700 | $226,400 |
| 2023 | $3,640 | $254,700 | $85,100 | $169,600 |
| 2022 | $3,422 | $220,200 | $80,900 | $139,300 |
| 2021 | $3,302 | $211,800 | $80,900 | $130,900 |
| 2020 | $3,397 | $210,200 | $80,900 | $129,300 |
| 2019 | $3,740 | $227,100 | $80,900 | $146,200 |
| 2018 | $3,524 | $211,900 | $80,900 | $131,000 |
| 2017 | $3,420 | $204,900 | $80,900 | $124,000 |
| 2016 | $3,300 | $200,100 | $80,900 | $119,200 |
| 2015 | $3,105 | $197,400 | $80,900 | $116,500 |
| 2014 | $2,909 | $191,900 | $76,000 | $115,900 |
Source: Public Records
Map
Nearby Homes
Your Personal Tour Guide
Ask me questions while you tour the home.