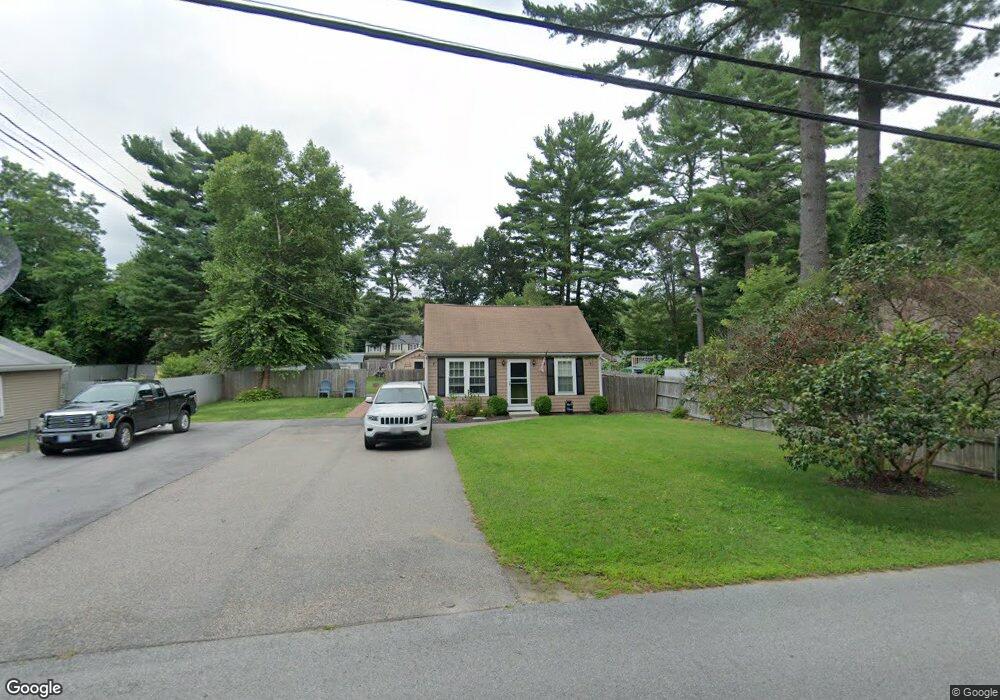
151 Mishnock Rd West Greenwich, RI 02817
Estimated Value: $311,000 - $379,000
2
Beds
1
Bath
884
Sq Ft
$376/Sq Ft
Est. Value
About This Home
This home is located at 151 Mishnock Rd, West Greenwich, RI 02817 and is currently estimated at $332,614, approximately $376 per square foot. 151 Mishnock Rd is a home located in Kent County with nearby schools including Mildred E. Lineham School, Metcalf School, and Wawaloam School.
Ownership History
Date
Name
Owned For
Owner Type
Purchase Details
Closed on
Apr 30, 2013
Sold by
Kevin T Richard Rt and Richard Kevin T
Bought by
Hart Debra J
Current Estimated Value
Home Financials for this Owner
Home Financials are based on the most recent Mortgage that was taken out on this home.
Original Mortgage
$136,734
Outstanding Balance
$96,925
Interest Rate
3.64%
Mortgage Type
New Conventional
Estimated Equity
$235,689
Purchase Details
Closed on
Nov 1, 2010
Sold by
Richard Kevin T
Bought by
Kevin T Richard Ret
Create a Home Valuation Report for This Property
The Home Valuation Report is an in-depth analysis detailing your home's value as well as a comparison with similar homes in the area
Home Values in the Area
Average Home Value in this Area
Purchase History
| Date | Buyer | Sale Price | Title Company |
|---|---|---|---|
| Hart Debra J | $134,000 | -- | |
| Kevin T Richard Ret | -- | -- | |
| Hart Debra J | $134,000 | -- | |
| Kevin T Richard Ret | -- | -- |
Source: Public Records
Mortgage History
| Date | Status | Borrower | Loan Amount |
|---|---|---|---|
| Open | Kevin T Richard Ret | $136,734 | |
| Closed | Kevin T Richard Ret | $136,734 | |
| Previous Owner | Kevin T Richard Ret | $90,000 |
Source: Public Records
Tax History Compared to Growth
Tax History
| Year | Tax Paid | Tax Assessment Tax Assessment Total Assessment is a certain percentage of the fair market value that is determined by local assessors to be the total taxable value of land and additions on the property. | Land | Improvement |
|---|---|---|---|---|
| 2025 | $3,414 | $213,400 | $89,100 | $124,300 |
| 2024 | $3,414 | $213,400 | $89,100 | $124,300 |
| 2023 | $3,226 | $131,600 | $62,700 | $68,900 |
| 2022 | $3,226 | $131,600 | $62,700 | $68,900 |
| 2021 | $3,162 | $131,600 | $62,700 | $68,900 |
| 2020 | $3,131 | $131,600 | $62,700 | $68,900 |
| 2019 | $3,435 | $142,100 | $77,800 | $64,300 |
| 2018 | $2,805 | $118,400 | $54,400 | $64,000 |
| 2017 | $2,670 | $118,400 | $54,400 | $64,000 |
| 2016 | $2,855 | $126,600 | $54,600 | $72,000 |
| 2015 | $2,855 | $126,600 | $54,600 | $72,000 |
| 2013 | $2,627 | $116,500 | $59,000 | $57,500 |
Source: Public Records
Map
Nearby Homes