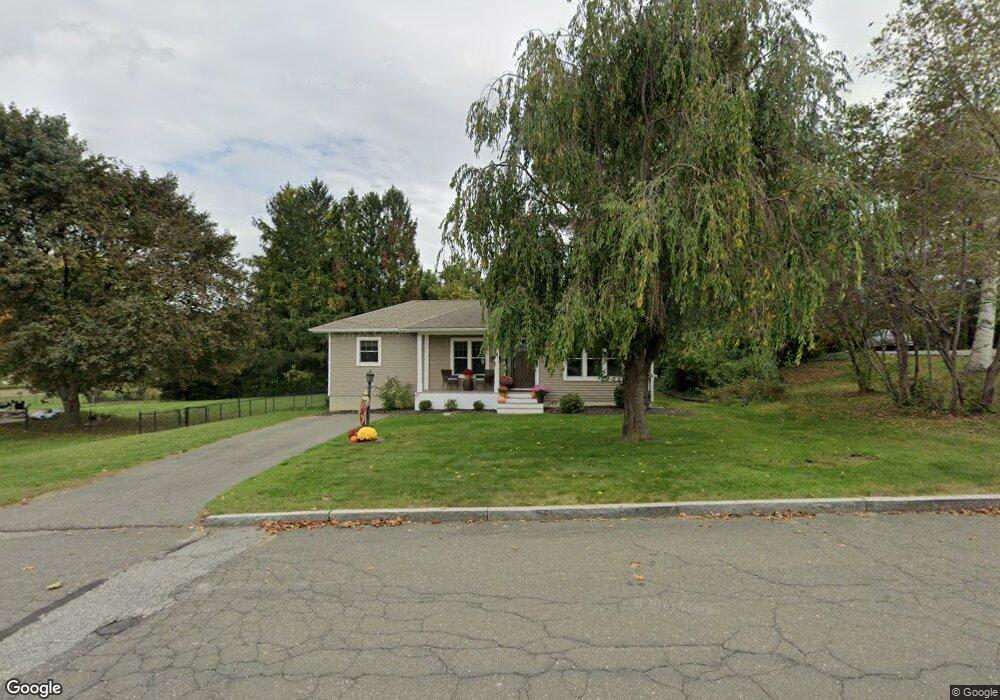
151 Moore St Chicopee, MA 01013
Chicopee Center NeighborhoodEstimated Value: $308,000 - $358,000
3
Beds
1
Bath
1,452
Sq Ft
$228/Sq Ft
Est. Value
About This Home
This home is located at 151 Moore St, Chicopee, MA 01013 and is currently estimated at $331,318, approximately $228 per square foot. 151 Moore St is a home located in Hampden County with nearby schools including Bowe Elementary School, Fairview Middle School, and Chicopee High School.
Ownership History
Date
Name
Owned For
Owner Type
Purchase Details
Closed on
Sep 30, 2004
Sold by
Peters Janice Q and Quinn Kathleen M
Bought by
Shlaferman Eric B and Shlaferman Margaret A
Current Estimated Value
Home Financials for this Owner
Home Financials are based on the most recent Mortgage that was taken out on this home.
Original Mortgage
$146,343
Outstanding Balance
$72,671
Interest Rate
5.81%
Mortgage Type
Purchase Money Mortgage
Estimated Equity
$258,647
Purchase Details
Closed on
May 1, 1997
Sold by
Kowalczyk Stella K Est
Bought by
Quinn Kathleen M
Create a Home Valuation Report for This Property
The Home Valuation Report is an in-depth analysis detailing your home's value as well as a comparison with similar homes in the area
Home Values in the Area
Average Home Value in this Area
Purchase History
| Date | Buyer | Sale Price | Title Company |
|---|---|---|---|
| Shlaferman Eric B | $147,500 | -- | |
| Quinn Kathleen M | $110,000 | -- |
Source: Public Records
Mortgage History
| Date | Status | Borrower | Loan Amount |
|---|---|---|---|
| Open | Shlaferman Eric B | $146,343 |
Source: Public Records
Tax History
| Year | Tax Paid | Tax Assessment Tax Assessment Total Assessment is a certain percentage of the fair market value that is determined by local assessors to be the total taxable value of land and additions on the property. | Land | Improvement |
|---|---|---|---|---|
| 2025 | $4,713 | $310,900 | $101,500 | $209,400 |
| 2024 | $4,465 | $302,500 | $99,500 | $203,000 |
| 2023 | $4,130 | $272,600 | $90,400 | $182,200 |
| 2022 | $3,248 | $191,200 | $78,600 | $112,600 |
| 2021 | $3,133 | $177,900 | $71,500 | $106,400 |
| 2020 | $2,839 | $162,600 | $63,300 | $99,300 |
| 2019 | $10 | $155,300 | $63,300 | $92,000 |
| 2018 | $2,723 | $148,700 | $60,300 | $88,400 |
| 2017 | $2,346 | $135,500 | $60,300 | $75,200 |
| 2016 | $2,354 | $139,200 | $60,300 | $78,900 |
| 2015 | $2,449 | $139,600 | $60,300 | $79,300 |
| 2014 | $2,305 | $139,600 | $60,300 | $79,300 |
Source: Public Records
Map
Nearby Homes
- 61 Abbey Memorial Dr Unit 153
- 85 Orchard St
- 2 Marion St
- Lot 1 Marion St
- 15 Hyde Ave
- 1078 Liberty St
- 248 Hampden St
- 103 Ontario St
- 35 Lower Grape St
- 491-493 Newbury St
- 69 Beston St
- 59 Piedmont St
- 13 Beston St
- 27 Abbey St
- 101 Huntington Ave
- 95 Washington St
- 0 Nelson St
- 325 Granby Rd
- 118 Wait St
- 121 Wait St
Your Personal Tour Guide
Ask me questions while you tour the home.