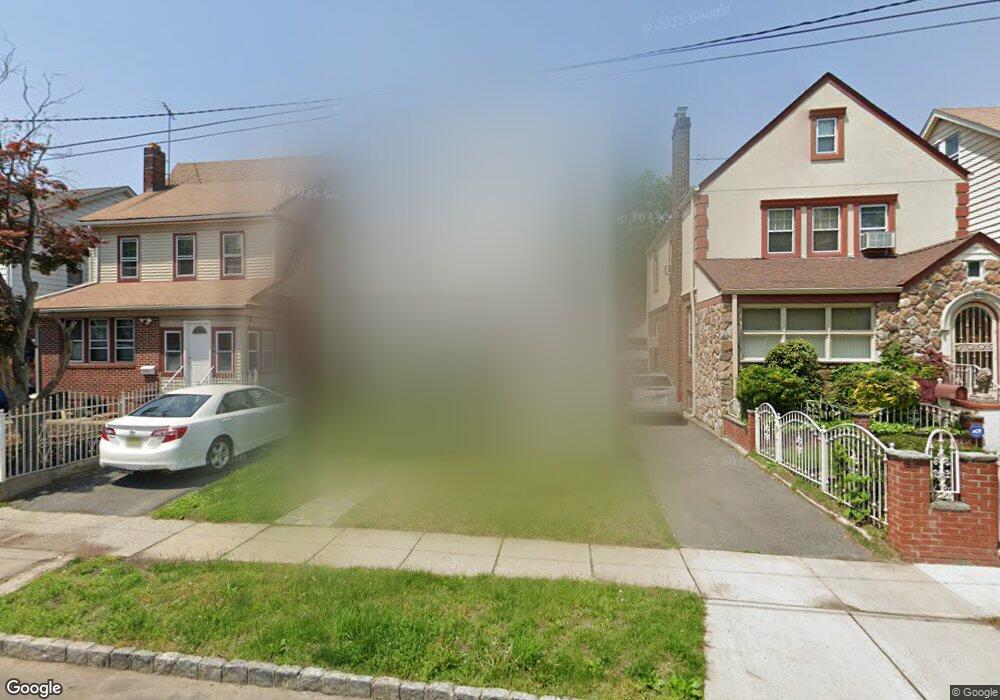
151 N 17th St Bloomfield, NJ 07003
Estimated Value: $485,000 - $537,000
Studio
--
Bath
1,731
Sq Ft
$291/Sq Ft
Est. Value
About This Home
This home is located at 151 N 17th St, Bloomfield, NJ 07003 and is currently estimated at $504,112, approximately $291 per square foot. 151 N 17th St is a home located in Essex County with nearby schools including Carteret School, Bloomfield Middle School, and Bloomfield High School.
Ownership History
Date
Name
Owned For
Owner Type
Purchase Details
Closed on
Nov 27, 2000
Sold by
Pham Hue Q
Bought by
Sugito Adrian and Awaluddin Ariana
Current Estimated Value
Home Financials for this Owner
Home Financials are based on the most recent Mortgage that was taken out on this home.
Original Mortgage
$152,000
Outstanding Balance
$55,771
Interest Rate
7.64%
Estimated Equity
$448,341
Purchase Details
Closed on
Oct 31, 1996
Sold by
Izquierdo Juan
Bought by
Pham Hue and Pham Helen
Home Financials for this Owner
Home Financials are based on the most recent Mortgage that was taken out on this home.
Original Mortgage
$102,000
Interest Rate
8.1%
Mortgage Type
FHA
Create a Home Valuation Report for This Property
The Home Valuation Report is an in-depth analysis detailing your home's value as well as a comparison with similar homes in the area
Home Values in the Area
Average Home Value in this Area
Purchase History
| Date | Buyer | Sale Price | Title Company |
|---|---|---|---|
| Sugito Adrian | $160,000 | -- | |
| Pham Hue | $141,700 | -- |
Source: Public Records
Mortgage History
| Date | Status | Borrower | Loan Amount |
|---|---|---|---|
| Open | Sugito Adrian | $152,000 | |
| Previous Owner | Pham Hue | $102,000 |
Source: Public Records
Tax History
| Year | Tax Paid | Tax Assessment Tax Assessment Total Assessment is a certain percentage of the fair market value that is determined by local assessors to be the total taxable value of land and additions on the property. | Land | Improvement |
|---|---|---|---|---|
| 2025 | $10,169 | $299,800 | $89,200 | $210,600 |
| 2024 | $9,797 | $299,800 | $89,200 | $210,600 |
| 2022 | $9,600 | $299,800 | $89,200 | $210,600 |
| 2021 | $9,423 | $299,800 | $89,200 | $210,600 |
| 2020 | $9,279 | $299,800 | $89,200 | $210,600 |
| 2019 | $10,028 | $251,900 | $88,000 | $163,900 |
| 2018 | $9,985 | $251,900 | $88,000 | $163,900 |
| 2017 | $9,834 | $251,900 | $88,000 | $163,900 |
| 2016 | $9,723 | $251,900 | $88,000 | $163,900 |
| 2015 | $9,635 | $251,900 | $88,000 | $163,900 |
| 2014 | $9,459 | $251,900 | $88,000 | $163,900 |
Source: Public Records
Map
Nearby Homes
- 171 Ampere Pkwy
- 159 Leslie St
- 105 N 15th St
- 77 Warwick St
- 220 N 17th St
- 7 Whitman Ave
- 431 Abington Ave
- 101 Ellington St
- 413 Beardsley Ave
- 427-429 N 12th St
- 243 N 15th St
- 454 N 11th St
- 352 N 12th St
- 62 Ampere Pkwy
- 32 Newfield St
- 51 Ampere Pkwy
- 386 N 11th St
- 47 Ampere Pkwy
- 193 Hoffman Blvd
- 43 Ampere Pkwy
Your Personal Tour Guide
Ask me questions while you tour the home.