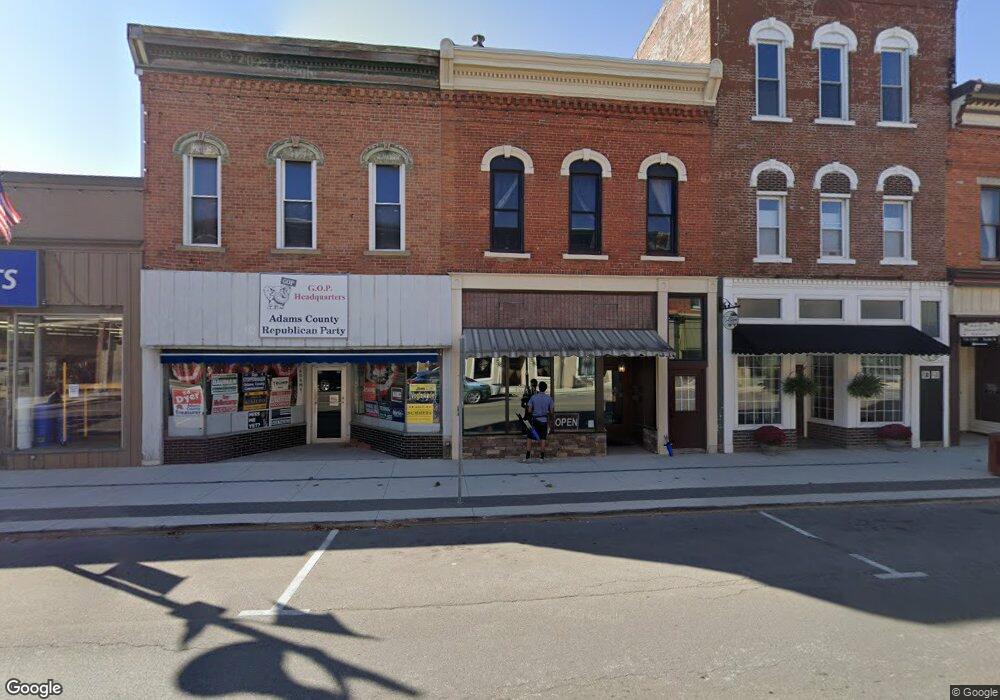
151 N 2nd St Decatur, IN 46733
Estimated Value: $116,254
--
Bed
--
Bath
3,960
Sq Ft
$29/Sq Ft
Est. Value
About This Home
This home is located at 151 N 2nd St, Decatur, IN 46733 and is currently estimated at $116,254, approximately $29 per square foot. 151 N 2nd St is a home located in Adams County with nearby schools including Southeast Elementary School, Bellmont Elementary School, and Bellmont Middle School.
Ownership History
Date
Name
Owned For
Owner Type
Purchase Details
Closed on
Feb 3, 2017
Sold by
Ed Dyer Holdings Llc
Bought by
Java Bean Cafe Llc
Current Estimated Value
Home Financials for this Owner
Home Financials are based on the most recent Mortgage that was taken out on this home.
Original Mortgage
$48,000
Outstanding Balance
$24,254
Interest Rate
4.2%
Mortgage Type
Commercial
Estimated Equity
$92,000
Purchase Details
Closed on
Oct 9, 2012
Sold by
The Java Bean Cafe Llc
Bought by
To Ed Dyer Holdings Llc
Purchase Details
Closed on
Aug 22, 2008
Sold by
Red Bird Properties Lp
Bought by
The Java Bean Cafe Inc
Home Financials for this Owner
Home Financials are based on the most recent Mortgage that was taken out on this home.
Original Mortgage
$90,000
Interest Rate
6.42%
Mortgage Type
Future Advance Clause Open End Mortgage
Create a Home Valuation Report for This Property
The Home Valuation Report is an in-depth analysis detailing your home's value as well as a comparison with similar homes in the area
Home Values in the Area
Average Home Value in this Area
Purchase History
| Date | Buyer | Sale Price | Title Company |
|---|---|---|---|
| Java Bean Cafe Llc | -- | None Available | |
| To Ed Dyer Holdings Llc | -- | None Available | |
| The Java Bean Cafe Inc | -- | -- |
Source: Public Records
Mortgage History
| Date | Status | Borrower | Loan Amount |
|---|---|---|---|
| Open | Java Bean Cafe Llc | $48,000 | |
| Previous Owner | The Java Bean Cafe Inc | $90,000 |
Source: Public Records
Tax History Compared to Growth
Tax History
| Year | Tax Paid | Tax Assessment Tax Assessment Total Assessment is a certain percentage of the fair market value that is determined by local assessors to be the total taxable value of land and additions on the property. | Land | Improvement |
|---|---|---|---|---|
| 2024 | $1,917 | $63,900 | $7,600 | $56,300 |
| 2023 | $1,905 | $63,500 | $7,600 | $55,900 |
| 2022 | $1,857 | $61,900 | $7,600 | $54,300 |
| 2021 | $1,740 | $58,000 | $7,600 | $50,400 |
| 2020 | $1,740 | $58,000 | $7,600 | $50,400 |
| 2019 | $1,740 | $58,000 | $7,600 | $50,400 |
| 2018 | $1,740 | $58,000 | $7,600 | $50,400 |
| 2017 | $1,356 | $45,200 | $7,600 | $37,600 |
| 2016 | $1,342 | $44,800 | $7,600 | $37,200 |
| 2014 | $1,265 | $44,700 | $7,600 | $37,100 |
| 2013 | $1,310 | $45,100 | $7,600 | $37,500 |
Source: Public Records
Map
Nearby Homes
- 110 S 4th St
- 347 S 3rd St
- 618 Adams St
- 409 Sunset Ln
- 433 Line St
- 410 Stratton Way
- 115 N 11th St
- 130 S 11th St
- 604 Washington St
- 704 Washington St
- 839 N 10th St
- 909 Line St
- 200 East Dr
- 930 N 11th St
- 1515 W Monroe St
- 1705 W Monroe St
- TBD Morningstar Blvd
- 109 Bellmont Blvd
- 773 Sycamore St
- 5970 N Piqua Rd