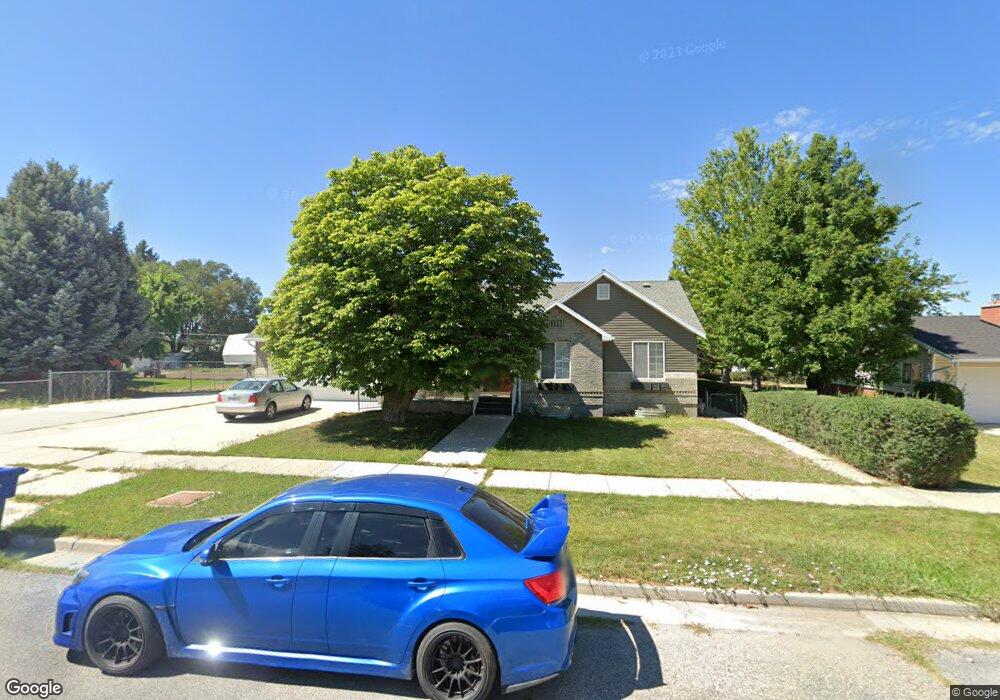
151 N 400 W Brigham City, UT 84302
Estimated Value: $428,857 - $513,000
5
Beds
3
Baths
2,700
Sq Ft
$173/Sq Ft
Est. Value
About This Home
This home is located at 151 N 400 W, Brigham City, UT 84302 and is currently estimated at $467,214, approximately $173 per square foot. 151 N 400 W is a home located in Box Elder County with nearby schools including Discovery School, Box Elder Middle School, and Adele C. Young Intermediate School.
Ownership History
Date
Name
Owned For
Owner Type
Purchase Details
Closed on
May 28, 2013
Sold by
Cochran Noel
Bought by
Jensen Jeffrey O and Jensen Robert O
Current Estimated Value
Home Financials for this Owner
Home Financials are based on the most recent Mortgage that was taken out on this home.
Original Mortgage
$227,920
Outstanding Balance
$160,384
Interest Rate
3.25%
Mortgage Type
FHA
Estimated Equity
$306,830
Create a Home Valuation Report for This Property
The Home Valuation Report is an in-depth analysis detailing your home's value as well as a comparison with similar homes in the area
Home Values in the Area
Average Home Value in this Area
Purchase History
| Date | Buyer | Sale Price | Title Company |
|---|---|---|---|
| Jensen Jeffrey O | -- | Phillips Hansen Land Title |
Source: Public Records
Mortgage History
| Date | Status | Borrower | Loan Amount |
|---|---|---|---|
| Open | Jensen Jeffrey O | $227,920 |
Source: Public Records
Tax History Compared to Growth
Tax History
| Year | Tax Paid | Tax Assessment Tax Assessment Total Assessment is a certain percentage of the fair market value that is determined by local assessors to be the total taxable value of land and additions on the property. | Land | Improvement |
|---|---|---|---|---|
| 2025 | $2,315 | $448,594 | $105,000 | $343,594 |
| 2024 | $2,315 | $445,685 | $100,000 | $345,685 |
| 2023 | $2,466 | $486,059 | $95,000 | $391,059 |
| 2022 | $2,537 | $255,690 | $22,000 | $233,690 |
| 2021 | $1,930 | $308,613 | $40,000 | $268,613 |
| 2020 | $1,900 | $308,613 | $40,000 | $268,613 |
| 2019 | $1,767 | $152,741 | $22,000 | $130,741 |
| 2018 | $1,579 | $135,688 | $22,000 | $113,688 |
| 2017 | $1,362 | $202,744 | $16,500 | $172,744 |
| 2016 | $1,422 | $106,985 | $16,500 | $90,485 |
| 2015 | $1,309 | $98,759 | $16,500 | $82,259 |
| 2014 | $1,309 | $94,842 | $16,500 | $78,342 |
| 2013 | -- | $94,842 | $16,500 | $78,342 |
Source: Public Records
Map
Nearby Homes