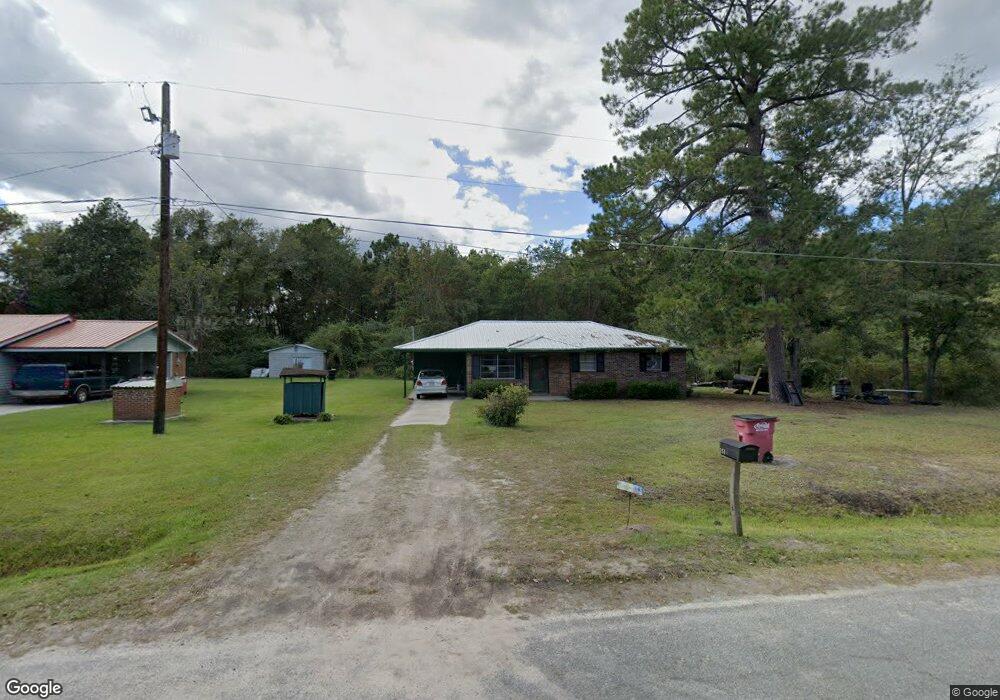
151 Old Ben Carter Rd Baxley, GA 31513
Estimated Value: $62,271 - $108,000
3
Beds
1
Bath
1,053
Sq Ft
$87/Sq Ft
Est. Value
About This Home
This home is located at 151 Old Ben Carter Rd, Baxley, GA 31513 and is currently estimated at $91,318, approximately $86 per square foot. 151 Old Ben Carter Rd is a home located in Appling County with nearby schools including Appling Christian Academy.
Ownership History
Date
Name
Owned For
Owner Type
Purchase Details
Closed on
Jan 8, 2021
Sold by
Sanders Leon
Bought by
Sanders Leon and Lewis Katrina Renee
Current Estimated Value
Purchase Details
Closed on
Aug 3, 2018
Sold by
Eason Fam Holdings Inc
Bought by
Sanders Leon
Purchase Details
Closed on
Sep 1, 2016
Bought by
Eason William K
Purchase Details
Closed on
Nov 1, 2011
Sold by
Defoer Ada
Bought by
Eason Family Holdings Inc
Purchase Details
Closed on
Nov 6, 2008
Sold by
Ram Developments Llc
Bought by
Defoer Ada
Purchase Details
Closed on
Jul 13, 2006
Sold by
Lasalle Bank National Asso
Bought by
Ram Developments Llc
Purchase Details
Closed on
Jan 3, 2006
Sold by
Sanders Earnest J
Bought by
Lasalle Bank National Associat
Purchase Details
Closed on
Apr 19, 2000
Sold by
United Companies Lending
Bought by
Sanders Ernest J and Sanders Aret
Purchase Details
Closed on
Nov 2, 1999
Sold by
Sanders Ernest J
Bought by
United Companies Lending
Create a Home Valuation Report for This Property
The Home Valuation Report is an in-depth analysis detailing your home's value as well as a comparison with similar homes in the area
Home Values in the Area
Average Home Value in this Area
Purchase History
| Date | Buyer | Sale Price | Title Company |
|---|---|---|---|
| Sanders Leon | -- | -- | |
| Sanders Leon | -- | -- | |
| Eason William K | -- | -- | |
| Eason Family Holdings Inc | $10,200 | -- | |
| Defoer Ada | $37,500 | -- | |
| Ram Developments Llc | $24,000 | -- | |
| Lasalle Bank National Associat | $20,400 | -- | |
| Sanders Ernest J | -- | -- | |
| United Companies Lending | $50,000 | -- |
Source: Public Records
Tax History
| Year | Tax Paid | Tax Assessment Tax Assessment Total Assessment is a certain percentage of the fair market value that is determined by local assessors to be the total taxable value of land and additions on the property. | Land | Improvement |
|---|---|---|---|---|
| 2024 | $75 | $7,895 | $1,080 | $6,815 |
| 2023 | $72 | $7,895 | $1,080 | $6,815 |
| 2022 | $45 | $5,511 | $1,080 | $4,431 |
| 2021 | $44 | $5,511 | $1,080 | $4,431 |
| 2020 | $48 | $5,511 | $1,080 | $4,431 |
| 2019 | $50 | $5,511 | $1,080 | $4,431 |
| 2018 | $153 | $5,511 | $1,080 | $4,431 |
| 2017 | $153 | $5,511 | $1,080 | $4,431 |
| 2016 | $153 | $5,511 | $1,080 | $4,431 |
| 2015 | $154 | $5,511 | $1,080 | $4,431 |
| 2014 | -- | $9,767 | $1,080 | $8,687 |
| 2013 | -- | $9,767 | $1,080 | $8,687 |
Source: Public Records
Map
Nearby Homes
- 675 N Main St
- 65 Fleming Dr
- 320 Brobston St
- 1380 Landing
- 336 Brobston St
- 89 W Ivey St
- 66 Weaver St
- 0 Golden Isle W Unit 10595385
- 0 W Parker St Unit 10547390
- 0 Hwy 341 Unit 23738
- 0 Hwy 341 Unit 10628717
- 0 U S Route 1
- 199 Anthony St
- 0 Hatch Pkwy N Unit A
- 0 Hatch Pkwy N Unit 23059
- 464 W Parker St
- 30 S McCrorie St
- 298 S Main St
- 213 Fair St
- 0 Wright Dr
- 111 Old Ben Carter Rd
- 131 Old Ben Carter Rd
- 840 Sursson St
- 11 Sanders Dr
- 67 Old Ben Carter Rd
- 188 Ben Carter Rd
- 258 Ben Carter Rd
- 284 Ben Carter Rd
- 212 Ben Carter Rd
- 302 Ben Carter Rd
- 318 Ben Carter Rd
- 319 Ben Carter Rd
- 939 Mlk Ave
- 0 Mlk Ave
- 904 Ga Highway 144
- 331 Ben Carter Rd
- 369 Old Ben Carter Rd
- 70 Rogers St
- 63 Rogers St
- 373 Ben Carter Rd