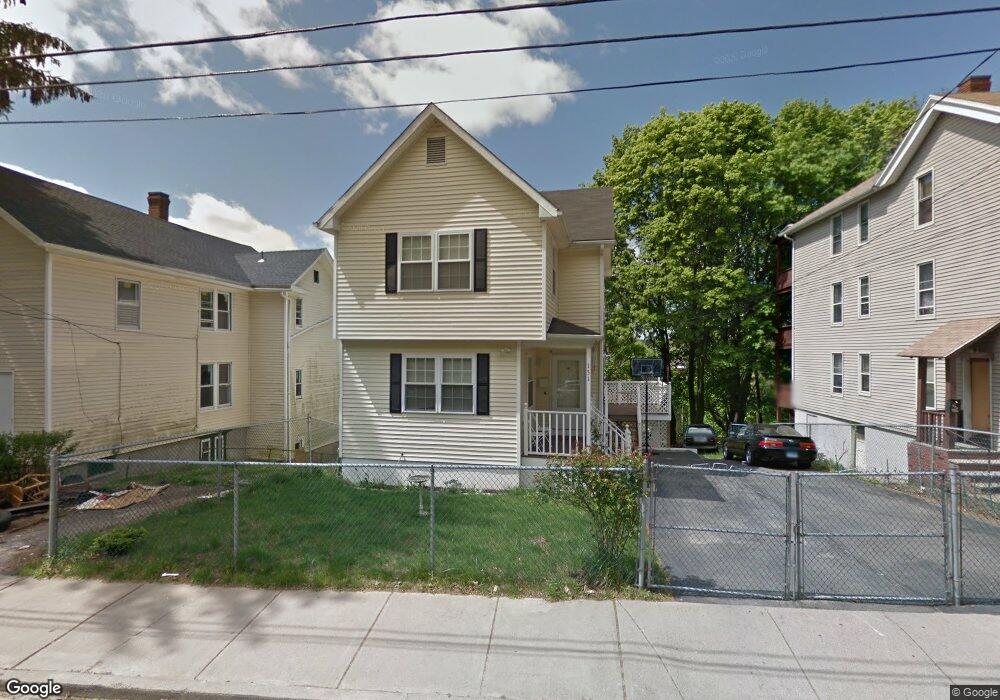
151 Orange St Waterbury, CT 06704
North End District NeighborhoodEstimated Value: $210,000 - $315,000
3
Beds
3
Baths
1,264
Sq Ft
$214/Sq Ft
Est. Value
About This Home
This home is located at 151 Orange St, Waterbury, CT 06704 and is currently estimated at $271,065, approximately $214 per square foot. 151 Orange St is a home located in New Haven County with nearby schools including B.W. Tinker School, West Side Middle School, and John F. Kennedy High School.
Ownership History
Date
Name
Owned For
Owner Type
Purchase Details
Closed on
Oct 18, 2005
Sold by
Santiago Edward and Mangual Carman A
Bought by
Aponte Erik
Current Estimated Value
Home Financials for this Owner
Home Financials are based on the most recent Mortgage that was taken out on this home.
Original Mortgage
$160,000
Interest Rate
5.78%
Mortgage Type
Purchase Money Mortgage
Purchase Details
Closed on
Dec 19, 2002
Sold by
Mangual Jose and Mangual Maria D
Bought by
Mangual Carmen A and Santiago Edward A
Home Financials for this Owner
Home Financials are based on the most recent Mortgage that was taken out on this home.
Original Mortgage
$83,889
Interest Rate
6.16%
Mortgage Type
Purchase Money Mortgage
Purchase Details
Closed on
Dec 6, 1991
Sold by
Waterbury Hsing Assist
Bought by
Mangual Jose and Mangual Maria
Create a Home Valuation Report for This Property
The Home Valuation Report is an in-depth analysis detailing your home's value as well as a comparison with similar homes in the area
Home Values in the Area
Average Home Value in this Area
Purchase History
| Date | Buyer | Sale Price | Title Company |
|---|---|---|---|
| Aponte Erik | $160,000 | -- | |
| Mangual Carmen A | $87,000 | -- | |
| Mangual Jose | $68,000 | -- | |
| Mangual Jose | $68,000 | -- |
Source: Public Records
Mortgage History
| Date | Status | Borrower | Loan Amount |
|---|---|---|---|
| Open | Mangual Jose | $168,800 | |
| Closed | Mangual Jose | $160,000 | |
| Previous Owner | Mangual Jose | $106,250 | |
| Previous Owner | Mangual Jose | $83,889 |
Source: Public Records
Tax History Compared to Growth
Tax History
| Year | Tax Paid | Tax Assessment Tax Assessment Total Assessment is a certain percentage of the fair market value that is determined by local assessors to be the total taxable value of land and additions on the property. | Land | Improvement |
|---|---|---|---|---|
| 2025 | $4,068 | $90,440 | $6,860 | $83,580 |
| 2024 | $4,471 | $90,440 | $6,860 | $83,580 |
| 2023 | $4,901 | $90,440 | $6,860 | $83,580 |
| 2022 | $3,180 | $52,820 | $6,840 | $45,980 |
| 2021 | $3,180 | $52,820 | $6,840 | $45,980 |
| 2020 | $3,180 | $52,820 | $6,840 | $45,980 |
| 2019 | $3,180 | $52,820 | $6,840 | $45,980 |
| 2018 | $3,180 | $52,820 | $6,840 | $45,980 |
| 2017 | $3,270 | $54,310 | $6,840 | $47,470 |
| 2016 | $3,270 | $54,310 | $6,840 | $47,470 |
| 2015 | $3,162 | $54,310 | $6,840 | $47,470 |
| 2014 | $3,162 | $54,310 | $6,840 | $47,470 |
Source: Public Records
Map
Nearby Homes