151 Palisades Point Unit 1512 Cincinnati, OH 45238
Riverside Sedamsville NeighborhoodEstimated Value: $199,000 - $244,240
3
Beds
3
Baths
1,391
Sq Ft
$157/Sq Ft
Est. Value
About This Home
This home is located at 151 Palisades Point Unit 1512, Cincinnati, OH 45238 and is currently estimated at $217,810, approximately $156 per square foot. 151 Palisades Point Unit 1512 is a home located in Hamilton County with nearby schools including Sayler Park Elementary School, Gilbert A. Dater High School, and Western Hills High School.
Ownership History
Date
Name
Owned For
Owner Type
Purchase Details
Closed on
Jun 9, 2020
Sold by
Ruberg Donald G and Ruberg Gail M
Bought by
Ruberg Donald G and Ruberg Gail M
Current Estimated Value
Purchase Details
Closed on
Mar 1, 2017
Sold by
Bassett Betty A
Bought by
Ruberg Donald G and Ruberg Gail M
Purchase Details
Closed on
Jul 21, 2015
Sold by
Weber Eileenb C
Bought by
Bassett Betty A
Purchase Details
Closed on
Oct 18, 2013
Sold by
Weber Eileen C
Bought by
Weber Eileen C and Eileen C Weber Revocable Trust
Purchase Details
Closed on
Apr 1, 2008
Sold by
Hamblet Hope G
Bought by
Weber Eileen C
Purchase Details
Closed on
Nov 3, 1999
Sold by
Hamblet Hope G and Hamblet John B
Bought by
Hamblet Hope G
Purchase Details
Closed on
Oct 27, 1998
Sold by
Palisades Ltd
Bought by
Hamblet John B and Hamblet Hope G
Create a Home Valuation Report for This Property
The Home Valuation Report is an in-depth analysis detailing your home's value as well as a comparison with similar homes in the area
Home Values in the Area
Average Home Value in this Area
Purchase History
| Date | Buyer | Sale Price | Title Company |
|---|---|---|---|
| Ruberg Donald G | -- | None Available | |
| Ruberg Donald G | $140,000 | -- | |
| Bassett Betty A | -- | Chicago Title Company Llc | |
| Weber Eileen C | -- | Attorney | |
| Weber Eileen C | $190,000 | Attorney | |
| Hamblet Hope G | -- | -- | |
| Hamblet John B | $180,000 | L & D Title Agency Inc | |
| Hamblet Hope G | $180,000 | -- |
Source: Public Records
Tax History Compared to Growth
Tax History
| Year | Tax Paid | Tax Assessment Tax Assessment Total Assessment is a certain percentage of the fair market value that is determined by local assessors to be the total taxable value of land and additions on the property. | Land | Improvement |
|---|---|---|---|---|
| 2024 | $2,042 | $44,233 | $8,050 | $36,183 |
| 2023 | $2,135 | $44,233 | $8,050 | $36,183 |
| 2022 | $2,735 | $49,018 | $6,650 | $42,368 |
| 2021 | $2,626 | $49,018 | $6,650 | $42,368 |
| 2020 | $2,714 | $49,018 | $6,650 | $42,368 |
| 2019 | $2,965 | $49,000 | $6,650 | $42,350 |
| 2018 | $2,970 | $49,000 | $6,650 | $42,350 |
| 2017 | $3,444 | $49,000 | $6,650 | $42,350 |
| 2016 | $3,937 | $55,266 | $6,773 | $48,493 |
| 2015 | $2,975 | $55,266 | $6,773 | $48,493 |
| 2014 | $2,997 | $55,266 | $6,773 | $48,493 |
| 2013 | $3,642 | $64,264 | $7,875 | $56,389 |
Source: Public Records
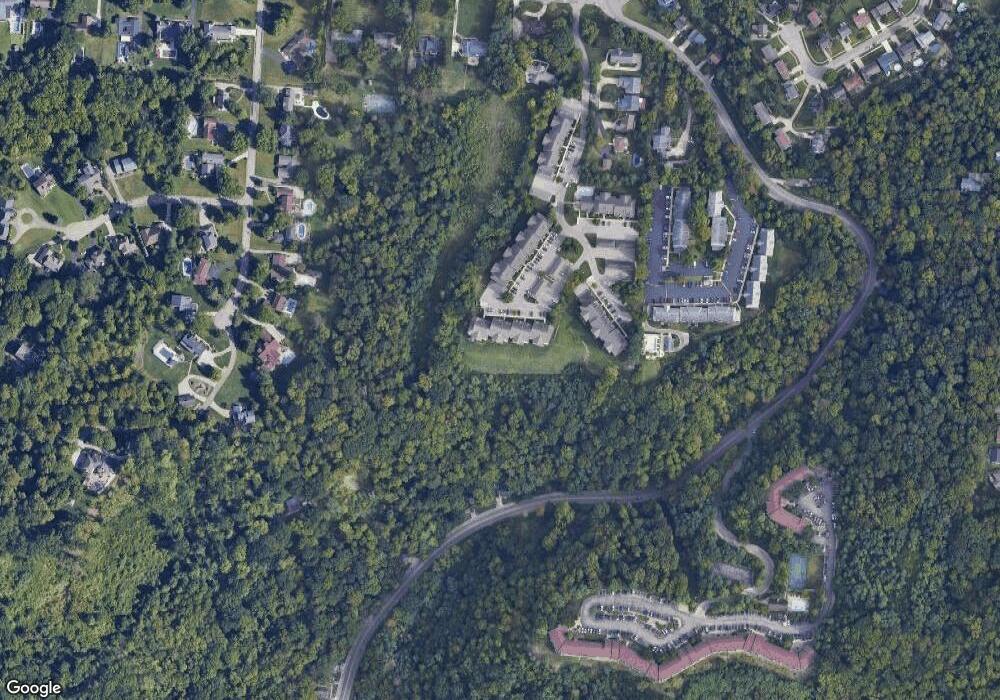
Map
Nearby Homes
- 155 Palisades Point
- 190 Anderson Ferry Rd
- 5062 Orangelawn Dr
- 311 Anderson Ferry Rd
- 5084 Francisvalley Ct
- 207 Greenwell Ave
- 5027 Giles Ct
- 263 Clareknoll Ct
- 5424 Delhi Rd
- 3938 Hillside Ave
- 3377 Hillside Ave
- 3389 Hillside Ave
- 309 Greenwell Ave
- 4189 River Rd
- 4231 River Rd Unit Parcel-A-B-C
- 4231 River Rd Unit Parcel-B
- 4231 River Rd Unit Parcel-A
- 4231 River Rd Unit Parcel-C
- 3018 Observatory Hill Ct
- 461 Happy Dr
- 151 Palisades Point
- 151 Palisades Point
- 155 Palisades Point
- 151 Palisades Point
- 155 Palisades Point Unit 1552
- 155 Palisades Point Unit 1553
- 155 Palisades Point
- 151 Palisades Point
- 155 Palisades Point Unit 1555
- 151 Palisades Point Unit 6
- 155 Palisades Point Unit 2
- 155 Palisades Point Unit 5
- 151 Palisades Point Unit POINTE
- 157 Palisades Point
- 157 Palisades Point
- 157 Palisades Point
- 157 Palisades Point
- 157 Palisades Point
- 157 Palisades Point Unit 1574
- 157 Palisades Point Unit 1