Estimated Value: $388,894 - $508,000
3
Beds
3
Baths
2,024
Sq Ft
$213/Sq Ft
Est. Value
About This Home
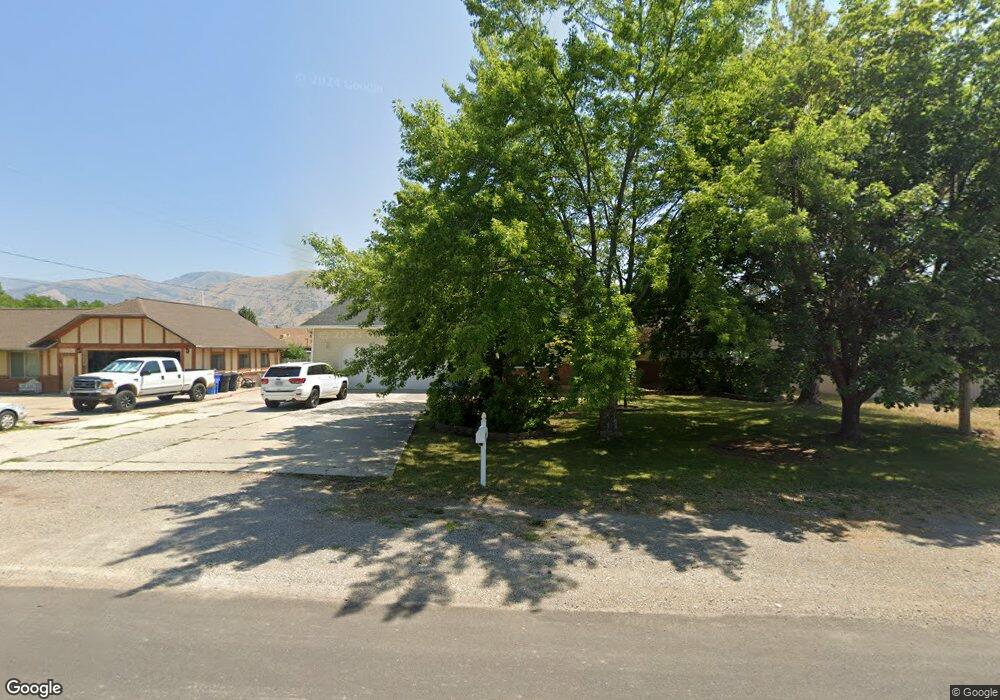
This home is located at 151 S 400 E, Hyrum, UT 84319 and is currently estimated at $430,974, approximately $212 per square foot. 151 S 400 E is a home located in Cache County with nearby schools including Lincoln School, South Cache Middle School, and Mountain Crest High School.
Ownership History
Date
Name
Owned For
Owner Type
Purchase Details
Closed on
Jul 19, 2017
Sold by
Shell Jill and Gerstner Jill
Bought by
Phelps Kristine
Current Estimated Value
Home Financials for this Owner
Home Financials are based on the most recent Mortgage that was taken out on this home.
Original Mortgage
$196,969
Outstanding Balance
$163,296
Interest Rate
3.9%
Mortgage Type
New Conventional
Estimated Equity
$267,678
Purchase Details
Closed on
Sep 22, 2010
Sold by
Shell Wayne
Bought by
Shell Jill
Purchase Details
Closed on
Feb 6, 2006
Sold by
Dickey Kaylene H and Olsen Kaylene H
Bought by
Dickey Thomas B and Dickey Kaylene H
Purchase Details
Closed on
Aug 1, 2002
Sold by
Olsen Jill
Bought by
Shell Wayne and Shell Jill
Purchase Details
Closed on
Jan 29, 2001
Sold by
Olsen Blake
Bought by
Olsen Jill
Create a Home Valuation Report for This Property
The Home Valuation Report is an in-depth analysis detailing your home's value as well as a comparison with similar homes in the area
Home Values in the Area
Average Home Value in this Area
Purchase History
| Date | Buyer | Sale Price | Title Company |
|---|---|---|---|
| Phelps Kristine | -- | Cache Title Company Inc | |
| Shell Jill | -- | None Available | |
| Dickey Thomas B | -- | None Available | |
| Shell Wayne | -- | Northern Title Company | |
| Olsen Jill | -- | Northern Title Company |
Source: Public Records
Mortgage History
| Date | Status | Borrower | Loan Amount |
|---|---|---|---|
| Open | Phelps Kristine | $196,969 |
Source: Public Records
Tax History
| Year | Tax Paid | Tax Assessment Tax Assessment Total Assessment is a certain percentage of the fair market value that is determined by local assessors to be the total taxable value of land and additions on the property. | Land | Improvement |
|---|---|---|---|---|
| 2025 | $1,542 | $221,325 | $0 | $0 |
| 2024 | $1,653 | $221,645 | $0 | $0 |
| 2023 | $1,500 | $192,365 | $0 | $0 |
| 2022 | $1,566 | $192,365 | $0 | $0 |
| 2021 | $1,501 | $284,050 | $65,050 | $219,000 |
| 2020 | $1,394 | $247,550 | $65,050 | $182,500 |
| 2019 | $1,149 | $191,966 | $38,000 | $153,966 |
| 2018 | $1,043 | $168,480 | $38,000 | $130,480 |
| 2017 | $1,014 | $84,975 | $0 | $0 |
| 2016 | $1,037 | $84,975 | $0 | $0 |
| 2015 | $1,039 | $84,975 | $0 | $0 |
| 2014 | $931 | $77,825 | $0 | $0 |
| 2013 | -- | $77,825 | $0 | $0 |
Source: Public Records
Map
Nearby Homes
Your Personal Tour Guide
Ask me questions while you tour the home.